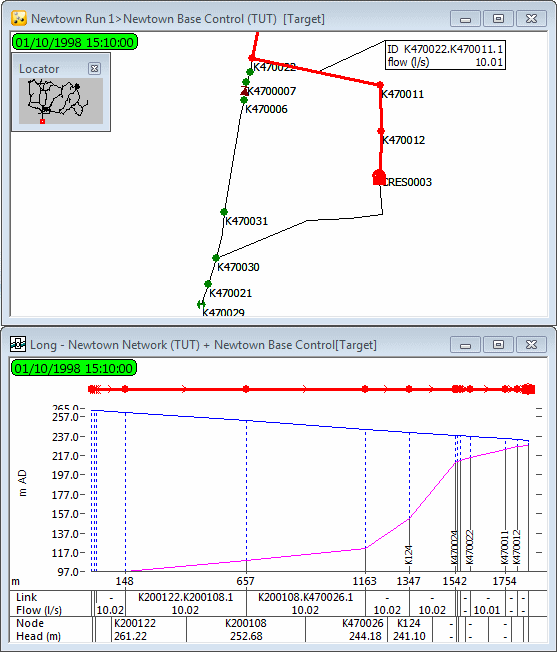
The results from a run can be viewed for a particular series of pipes by replaying the simulation in the Long Section view.
This stage assumes that you have started InfoWorks WS Pro and that the Model Group window is open, showing the Newtown icon.
To illustrate how to view results in the Long Section view, we will use the Newtown Base Control simulation within the Newtown Run 1 run group.
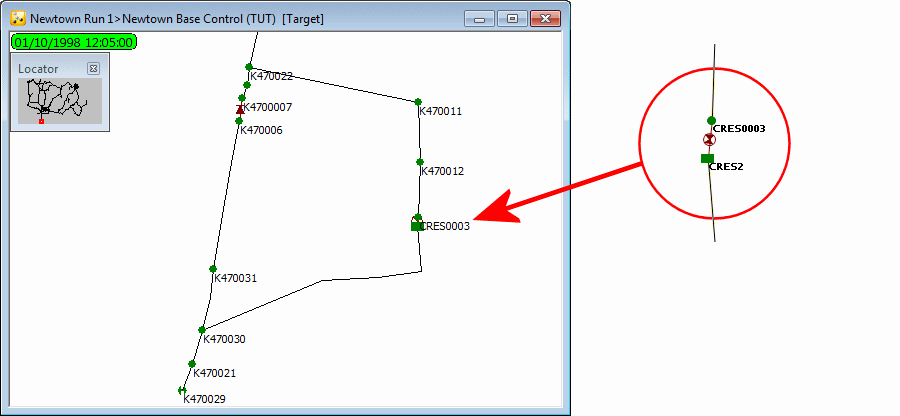
- If the simulation is not open in the current window, drag it onto the main window. Zoom in on the area around the reservoir CRES2.
- Select the
 (Long section pick) tool
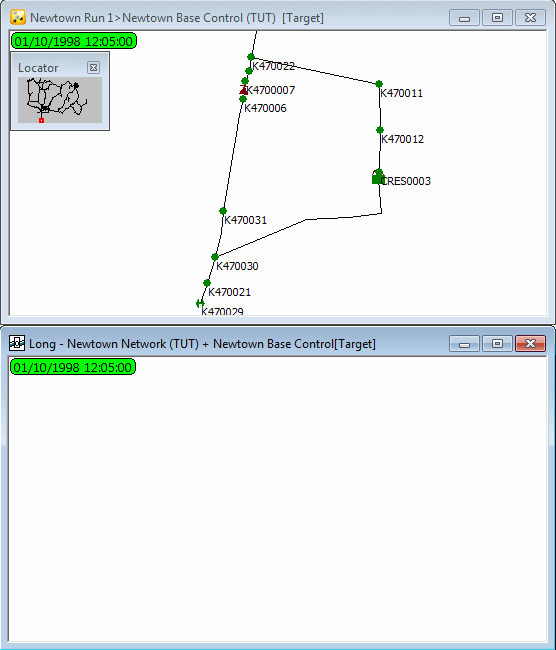
and click a blank area of the GeoPlan. An empty Long Section view is
displayed. If required, use the
  (Pan) tool and zoom options to adjust the display in the GeoPlan view.
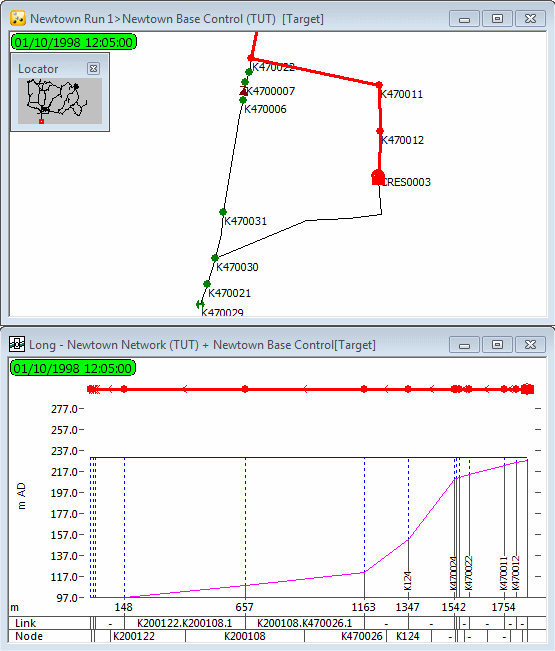
- At this stage, you can either select one or several objects using the available selection tools or drag a selection list, which has previously been saved, from the Selection List group onto the GeoPlan view. In our example, we are going to use the existing 'Pumps To CRES2' selection. Drag this selection onto the GeoPlan view.
- Right-click the Long Section view and select
.
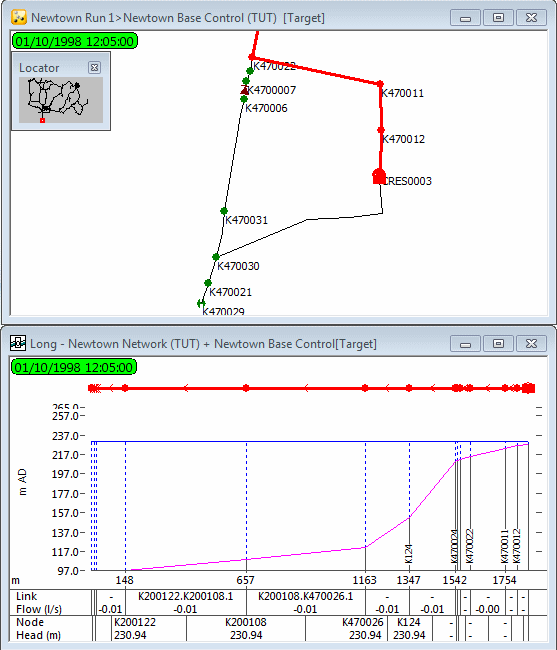
- The Long Section view is displayed for the selection. We are now going to set up some labels on the Long Section view. This is a valuable feature that can help you visualise the variations of some parameters of interest, as the simulation is run. For this, right-click the Long Section view and select .
- In the Long Labels section, click the button.
- In our example, we are going to select the following parameters in the Network Label Field Settings dialog (available only if there is a simulation):
- 'head (Head)' for Node
- 'flow (Flow)' for Pipe
- Click on
each of the dialogs.
- Let us display as well some of the above parameters on the GeoPlan view:
- Right-click the GeoPlan view and select .
- For the Pipe object layer, click in the Custom Label column.
- On the Content page of the Custom Label Settings: Pipe dialog, tick the box for Flow (available only if there is a simulation).
- Click on each of the dialogs.
- Add a label to one of the pipes leading to the reservoir. Replay the simulation. The long section illustrates the change in flow when the pump is switched on and off. The actual values are shown on the GeoPlan labels and at the bottom of the Long Section view.
- You can run the simulation and pause it at a specific time to observe values at that particular time. In our example, use the replay
buttons to take the simulation time to 15:10. The label shows that water
is flowing back from the reservoir to the demands.
- Close the Long Section view and clear the selection on the GeoPlan View.

