Headloss
|
Innovyze Howbery Park Wallingford Oxfordshire OX10 8BA United Kingdom +44 (01491 821400 |
|
||
|
Technical Paper January 2015 |
|||
1. Introduction
This paper describes headloss and supplements the InfoWorks on-line help. It is of particular relevance to people trying to replicate the InfoWorks results using hand calculations and for those dealing with special cases.
Headloss is calculated at the top of each conduit, to represent the energy lost due to turbulence at the transition between a manhole and a conduit. It is also calculated at the bottom of each conduit to represent the loss at transition from conduit to manhole. It is well known that there is greater turbulence, and therefore headloss, at the top of a conduit. This is one reason why flow meters are generally placed on the incoming pipe to a manhole.
The headloss equation is presented below:
|
|
where: Dh = headloss ku = user defined headloss factor ks = surcharge ratio coefficient kv = velocity coefficient v = flow velocity (m/s) g = acceleration due to gravity (m/s2) |
The user must specify the value of ku and the headloss type at the up and downstream end of each conduit. This is achieved by editing the data either in the Long section group of the conduit properties or in the conduit grid. The headloss type determines how ks and kv are calculated.
There are situations in which this equation does not apply:
- Manhole and pipe immediately downstream of the pipe in question are sufficiently lower so that they are effectively hydraulically independent. Here the headloss equations do not apply to the downstream end of the pipe and it acts similar to a free outfall.
- Pipe is empty; headloss does not apply to the notional baseflow required to achieve numerical stability.
- Headloss type of FHWA is set at conduit.
Section 2 of this report discusses how to determine the value of ku. Section 3 presents the headloss types and describes how they affect the ks and kv factors. Section 4 discusses the calculation of flow velocity (v). Section 5 presents a worked example of headloss calculation.
2. User Defined Headloss Factor (ku)
The user defined headloss factor is generally used to represent the fact that the amount of change of flow direction at a manhole affects headloss. It makes sense that more energy will be lost in a manhole where the flow passes through a 90° bend than where it goes straight through. The amount of change of direction is described by the angle of approach.
Figure 1 below shows how angle of approach is measured.
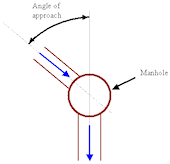
Figure 1 Angle of Approach
Table 1 below presents suggested values of ku for various angles of approach.
|
Angle of Approach |
Ku |
|---|---|
|
30 |
3.3 |
|
60 |
6.0 |
|
90 |
6.6 |
|
>90 |
8.0 |
Table 1 Angle of Approach
If a pipe includes several bends then the values of ku should be summed.
ku can be automatically applied to most pipes using the conduit headloss type and coefficient inference utility. This utility measures the angle of approach and interpolates a value of ku based on Table 1 above. It then assigns the value to the relevant up or downstream end of a pipe. Further information on inference is contained in the InfoWorks on-line help.
At junctions, inference assumes that angle of approach is calculated purely from the incoming pipe with the largest width (if there are several the same size it takes the largest angle.) There is debate about how the headloss factors from the smaller pipes should be included. Some suggestions on how to determine user defined headloss at junctions is presented below.
Consider a T junction like this:
.gif)
Figure 2 T Junction 1
If 0% of the flow comes from B.1, then the headloss coefficient at the top of C.1 would be 6.6 (a 90 degree bend.) If any flow comes from B.1 then it is suggested that the headloss should be increased. Work out the proportion of flow likely to come from B.1 based simply on the relative diameters of the pipes, as shown in the Table 2 below.
|
Link Number |
Diameter (mm) |
Area (m2) |
Proportion |
|---|---|---|---|
|
A.1 |
575 |
0.260 |
0.62 |
|
B.1 |
450 |
0.159 |
0.38 |
Table 2 Proportion of Flow
Therefore the total headloss at the upstream end of C.1 would be:
|
|
|
Take a slightly more complex case.
.gif)
Figure 3 More Complex Junction
To calculate the headloss to be applied to the upstream end of D.1.
|
Link Number |
Diameter (mm) |
Area (m2) |
Proportion |
|---|---|---|---|
|
A.1 |
900 |
0.636 |
0.59 |
|
B.1 |
600 |
0.283 |
0.26 |
|
C.1 |
450 |
0.159 |
0.15 |
Table 3 More Complex Proportion
|
|
|
So to conclude, take the 'major' branch and add to it the headloss from all subsidiary branches multiplied by the proportion of the flow which they provide.
Note this assumes that all pipes join at equal invert levels. Further adjustments will have to be applied if they do not. Also inference does not deal with this level of complexity.
3. Headloss Types

At junctions at which the two (or more) pipes arriving are of different shape (e.g. CIRC and RECT), inference will not be completed. The downstream headloss of the pipes arriving will be set to a type of NONE. The upstream headloss of the pipe(s) leaving will be set to a value of 1.0.
The user has a choice of six headloss types, as presented below:
- None
- Normal
- High
- Fixed
- User defined
- FHWA
A headloss type of None will mean that there is no headloss.
The FHWA headloss type is based on the FHWA Inlet and Access Hole Energy Loss method as described in section 7.1.6.7 of the FHWA HEC 22 Urban Drainage Manual. For a detailed description of the implementation in InfoWorks and worked examples see the FHWA Headloss in InfoWorks ICM article on the Innovyze Knowledgebase.
The other headloss types are described in the sections below.

It is important to note at this point that headlosses are always calculated with respect to the flow going from manhole to conduit. Therefore a negative value must be applied in the calculation of headloss at the downstream end of a conduit, where the flow goes from conduit to manhole.
In some headloss types this negative coefficient is automatically applied, in others it is not. It is explained in detail in the sections below.
3.1 Normal and High Headloss Type
A normal headloss type is appropriate for well-constructed manholes on pipe systems, or for small open channel systems. High is appropriate for badly constructed manholes that are benched only to half pipe height.
For the normal and high headloss types the surcharge ratio coefficient (ks) and the velocity coefficient are hard coded into the software, they are presented below.
3.1.1 Surcharge Ratio Coefficient (ks)
The surcharge ratio coefficient defines the relationship between headloss and the depth of flow in the pipe:
|
|
|
Flow depth is defined as the level in the node, minus the invert level of the pipe (immediately up or downstream of it.)
The relationship between surcharge ratio coefficient (ks) and surcharge ratio is presented in the InfoWorks on-line help and in Figure 4 below.
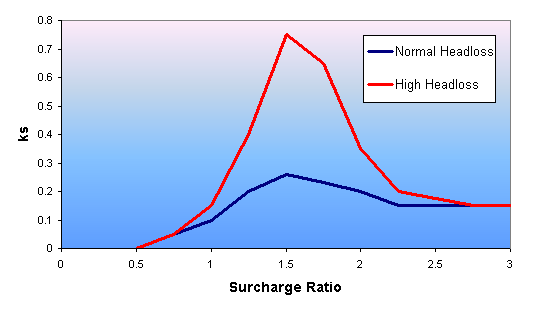
Figure 4 Normal and High Headloss Coefficients
For both the Normal and High headloss conditions, it can be seen that headloss is negligible when the pipe is less than half full and at a maximum at levels just above pipe full.
For these two headloss conditions InfoWorks automatically assumes that the flow is less turbulent at the downstream end of a conduit. It therefore applies a coefficient of –0.1 to the downstream headloss values. The value is negative for reasons described at the start of this section.
3.1.2. Velocity Coefficient (kv)
The velocity coefficient defines the relationship between headloss and velocity. It is based on the direction of flow with respect to the name of link. The relationship between kv and v for all values of v is presented in Table 4 below.
|
V |
kv |
|---|---|
|
< -0.02 |
0.1 |
|
-0.02 to 0.2 |
-0.1 + (v – ( -0.02)) * (1.0 – (-0.1)) / (0.2 – ( -0.02)) |
|
> 0.2 |
1.0 |
Table 4 Relationship Between kv and v
This relationship is also presented in Figure 5 below:
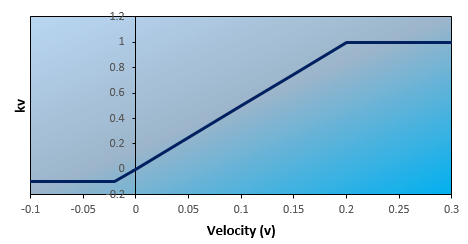
Figure 5 Relationship Between kv and v
3.2 Fixed Headloss Type
In the fixed headloss type, kv and ks equal 1.0 for all conditions. It should be noted that the factor of -0.1 applied to the downstream headloss for the Normal and High headloss types is not applied to the fixed.
3.3 User Defined Headloss
User defined headloss allows the user to specify a relationship between surcharge ratio and ks and between velocity and kv.
This is achieved by opening the network links grid and then selecting the headloss curve tab. Enter a new Headloss ID and then double left click on it (the Headloss ID name) to display the property sheet for the headloss curve. Figure 6 below presents an example user defined ks against surcharge ratio relationship. Using this example, any conduits with an up or downstream headloss type of 'User1' would utilise the defined relationship.
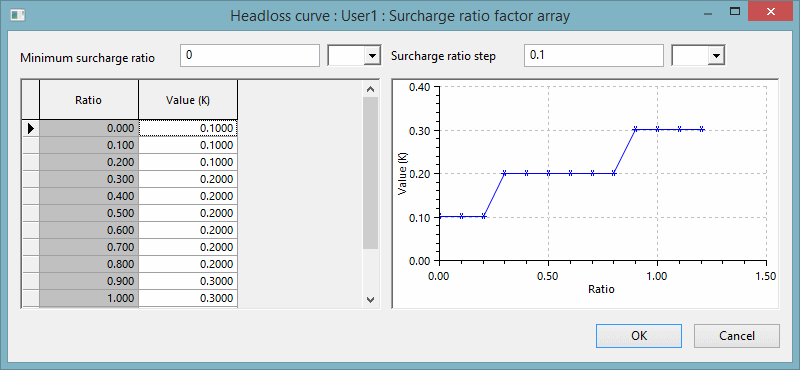
Figure 6 User Defined Headloss Coefficients
4. Flow Velocity
Flow velocity (v) is calculated from the equation:
|
|
where: Q = flow (m3/s) A = Pipe cross sectional area (m2) |
Note that by default 'A' is the cross sectional area of flow, but there is an option in the simulation parameters 'Use full area for headloss calculations' which implements a full pipe area approximation which can be used to keep simulation times to a minimum. Assessment of the surcharge ratio headloss factor (ks) shows that for normal and high headlosses, the greatest headloss occurs around pipe full flow and therefore this approximation is not considered significant.
There is some debate about which is the best method, as the area of flow method is strictly more correct, but seems to over predict headloss in some situations, particularly fast, shallow flows.
This approximation only applies to the calculation of headloss and does not affect velocity results presented in either graphical or tabular format, or water quality results.
5. Worked Examples
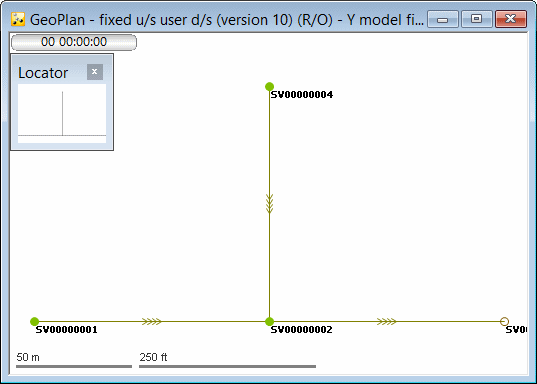
Figure 7 Example Network
Figure 7 above shows a simple three pipe network. 0.18 m3/s was applied to nodes SV00000001 and SV00000004. Figure 8 below shows a long section from SV00000004 to SV00000003 including the headloss conditions and hydraulic results.
- Pipe SV00000002.1 is 2 m wide.
- Q = 0.36 m3/s
- d = 0.116 m
Example 1 Flow Area Calculations
In this first example, the 'Use full area for headloss calculations' box in the simulation parameters is not ticked and therefore the area of the flow is used in the calculations.
\v = 0.36 / (2 x 0.1164) = 1.546 m/s. This matches the results presented in Figure 8
v2/2g = 0.122
Upstream headloss coefficient = 6.6
\ headloss = 6.6 x 0.122 = 0.805 m
The upstream invert level is +28 m AD.
Therefore level in node SV00000002 =
28 + 0.1164 + 0.805 = 28.921, which matches Figure 8.
The velocity in the downstream end of pipe SV00000004.1 is only 0.1929 m/s, due to the increased depth in this pipe.
v2/2g = 0.0019
Upstream headloss coefficient = 6.6
\ headloss = 6.6 x 0.0019 = 0.012 m
\depth in the downstream end of pipe SV00000004.1 =
28.921 – 28 + 0.012 = 0.933 m, which again matches Figure 8.
The downstream headloss coefficient in pipe SV00000001.1 is 1.0, therefore the downstream depth in this pipe is 0.923 m.
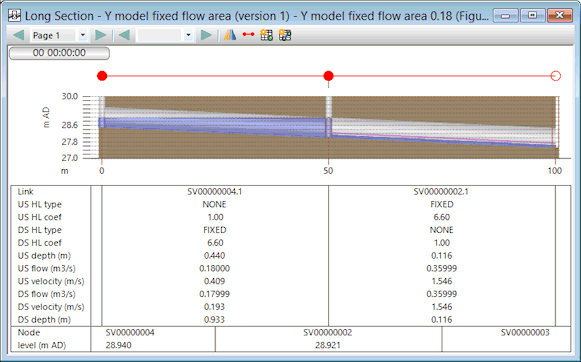
Figure 8 Example 1 Results
Example 2 Pipe Full Area Calculations
In this second example, the 'Use full area in headloss calculations' box in the simulation parameters is ticked and therefore the area of the pipe is used in the calculations.
v = 0.36 / (2 x 1) = 0.18 m/s.
This is the value used only in the headloss calculations and does not match the velocity results presented in Figure 9. This is not a mistake, it’s the way it’s meant to work.
v2/2g = 0.0016
Upstream headloss coefficient = 6.6
\ headloss = 6.6 x 0.0016 = 0.010 m
The upstream invert level is +28 m AD.
Therefore level in node SV00000002 =
28 + 0.116 + 0.010 = 28.126, which matches Figure 9.
Pipe SV00000004.1 is 1 m x 1 m.
\v = 0.18 m/s.
\ the headloss here is also 0.010 m.
\depth in the downstream end of pipe SV00000004.1 =
28.126 – 28 + 0.010 = 0.136 m, which again matches Figure 9.
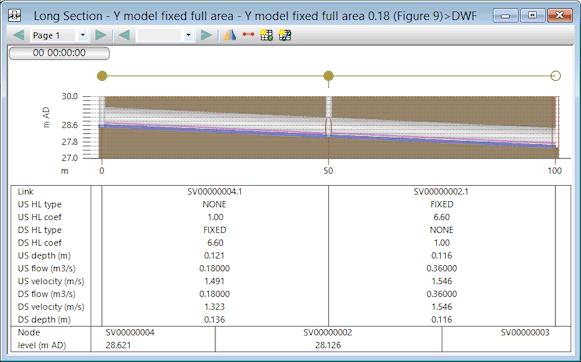
Figure 9 Example 2 Results
Example 3 Flow Area Calculations, Normal Headloss
When normal headloss is applied, headloss is calculated from equation 1, represented below.
|
|
|
In this example, the height of pipe SV00000002.1 was reduced to 275 mm, in order to create a reasonable surcharge ratio.
v = 2.646 m/s
v2/2g = 0.357
Pipe height = 275 mm, water level in node = 28.591 therefore surcharge ratio = (28.591 – 28.000) / 0.275 = 2.15
Therefore from interpolation of graph
ks = 0.172
velocity > 0.2 m/s therefore kv = 1.0
ku = 6.6
therefore headloss = 0.172 x 1.0 x 6.6 x 0.357 = 0.405 m
InfoWorks gives level in node – pipe invert level – depth in pipe =
28.591 – 28.00 – 0.189 = 0.402 m
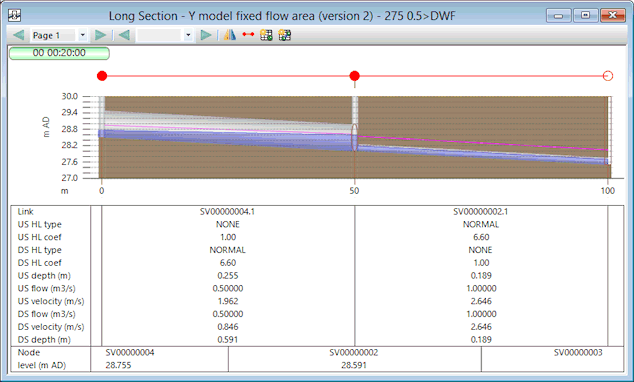
Figure 10 Example 3 Results
6. Further Reading
- Head Losses at Surcharged Manholes with a Main Pipe and a 90 degree Lateral, Gösta Lindvall, Proceedings of the Third International Conference on Urban Storm Drainage Göteborg, Sweden June 4 - 8, 1984, Volume 1 Analysis and Design of Stormwater Systems, pp 137-146.
- The Wallingford Procedure: Design and analysis of urban storm drainage. Volume 1: Principles, methods and practice. Hydraulics Research Ltd, 1983, p66
Article © Innovyze 2015