Representation of Inlets in InfoWorks
|
Innovyze Howbery Park Wallingford Oxfordshire OX10 8BA United Kingdom +44 (01491 821400 |
|
||
|
Technical Paper February 2012 |
|||
Contents
2. A Head / Discharge Relationship
3. Implementation of Equations Presented in HEC22 Manual
3.1.1 Depressed Curb Opening Inlet
4. Flow Efficiency Relationship
6.1 Understanding Results, Limit of Inflow
A.2 Depressed Continuous Curb Opening
A.5 SAG Curb Opening (Depressed Weir)
A.6 SAG Curb Opening (Orifice)
A.7 SAG Grate and SAG Combination Opening (Weir
Appendix B Advice on Flow Efficiency Relationship
1. Introduction
This paper describes the representation of inlets as implemented in InfoWorks ICM.
Inlets provide a means for surface runoff to get from a carriageway into a storm or combined sewer. An example of an inlet is shown in Figure 1.
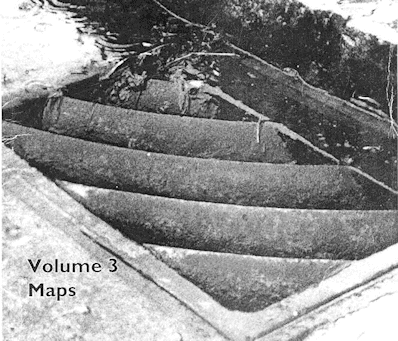
Figure 1 Inlet Example (Front Cover of Wallingford Procedure)
The effect of a modelled inlet is to limit the flow rate from the surface into the manhole, or vice versa. This can lead to the situation (as occurs in reality) where there is flooding on the catchment surface whilst there is available capacity in the below ground system, as shown in Figure 2.
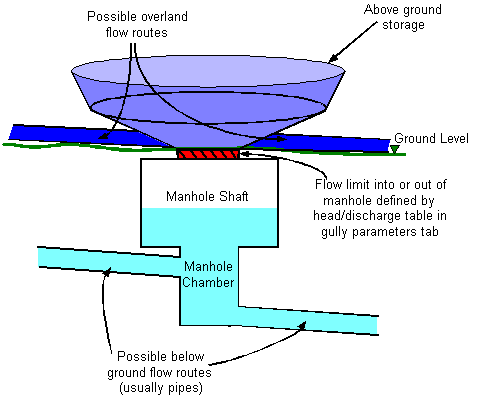
Figure 2 Effect of Inlet
The inlet flood type effectively divides the manhole into two elements, an above ground element (representing everything above ground level) and a below ground element, with a limitation on flow between them.
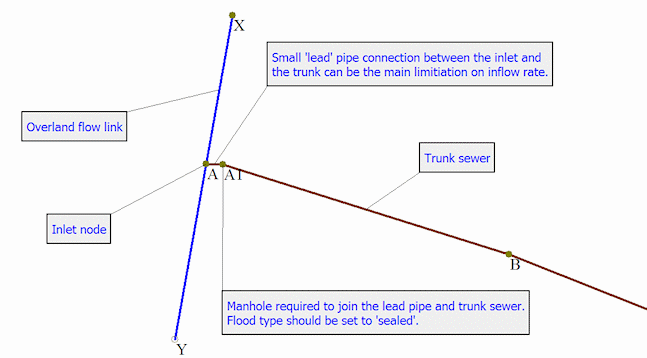
Figure 3 Typical Modelled Inlet Including 'Lead' Pipe
Figure 3 shows a typical inlet arrangement. A roadway is modelled, generally using open channels with a system type of 'overland', from node X to node A and from node A to node Y. Node A has a flood type of 'inlet' and depending on its characteristics, some of the flow will remain in the overland links and some will enter the below ground system. A small 'lead' pipe connects node A and node A1. This pipe sometimes provides the main limitation to flow entering the sewer. If it does not provide a constriction, there is little point in modelling it.
In many ways a manhole with an inlet flood type acts like any other manhole. Links (pipes, pumps, weirs etc) connect to it as they would to any other manhole type.
Links with a system type of 'overland' apply to the above ground element and are therefore subject to the restrictions applied by the inlet parameters. Links with a system type of 'foul', 'sanitary', 'storm', 'combined' or 'other' apply directly to the below ground element, regardless of relative ground and invert levels. Subcatchments with a system type of 'storm', 'combined' or 'overland' drain to the above ground element and are again subject to the inlet parameters before they can enter the below ground element, whereas those with 'foul', 'sanitary' or 'other' system types drain directly to the below ground element.
The inlet flood type is specified by using the drop down menu on the Manhole parameters section of the Manhole Object Properties Window shown in Figure 4, or by editing the Flood type column in the Nodes grid.
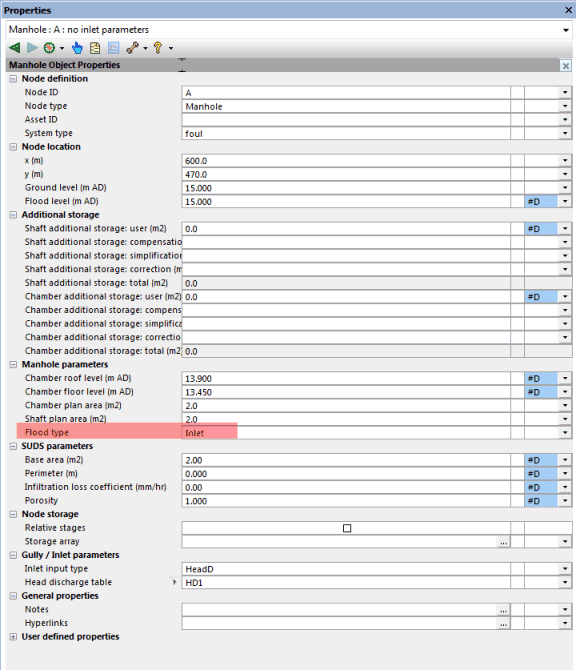
Figure 4 Specifying the Inlet Flood Type
When 'inlet' is specified, additional sections such as Node storage and Gully / Inlet parameters become available, as indicated on Figure 5.
The storage parameters define the relationship between the water level relative to the ground level and the area that the flooding occupies. This replaces the more simplistic flood cone. The storage parameters will usually be defined so that little storage is provided. This is because most of the above ground storage will be provided by the overland links.
There are four methods of defining an inlet.
- A head / discharge relationship, described in Chapter 2.
- A choice of equations presented in the HEC22 manual (Reference 1), described in Chapter 3.
- A flow / efficiency relationship, described in Chapter 4.
- A user defined equation, described in Chapter 5.
The Gully / Inlet parameters section includes an 'Inlet input type' where one of these four methods is chosen, as shown in Figure 5.
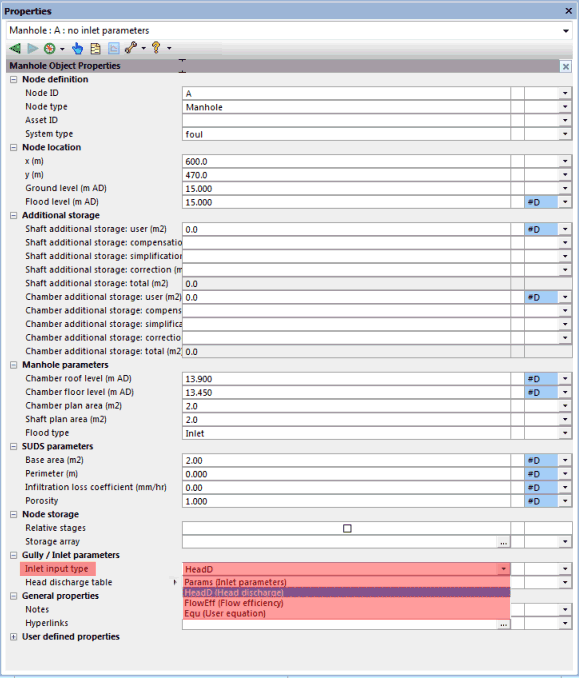
Figure 5 The Inlet input type field in the Gully / Inlet parameters section
Once a method is chosen, data can only be applied to the relevant fields in the Gully / Inlet parameters section. For example, in Figure 6, the inlet input type has been specified as 'flow efficiency'. A flow efficiency table is therefore required whilst other irrelevant fields are hidden.

Figure 6 Inlet flow efficient table required for flow efficiency inlet input type
2. A Head / Discharge Relationship
The head discharge relationship is the same as the 'gully' flood type. The only advantage to using the gully flood type is that it allows multiple gullies to be specified.
An example of the inlet tab including a specified head / discharge table (called HD1) is presented in Figure 7.
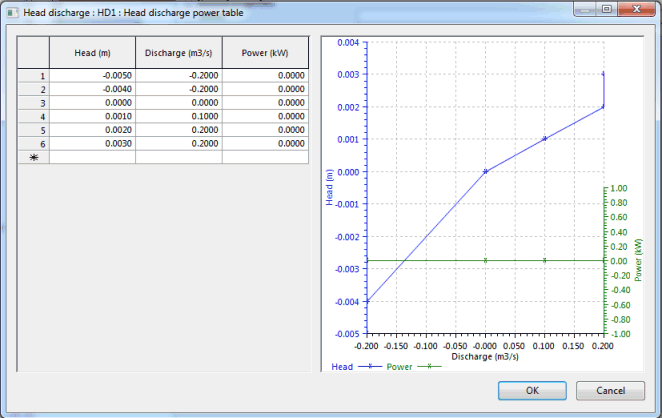
Figure 7 Specification of a Head / Discharge Table
Figure 8 shows an annotated part of a head discharge table (HD1.)
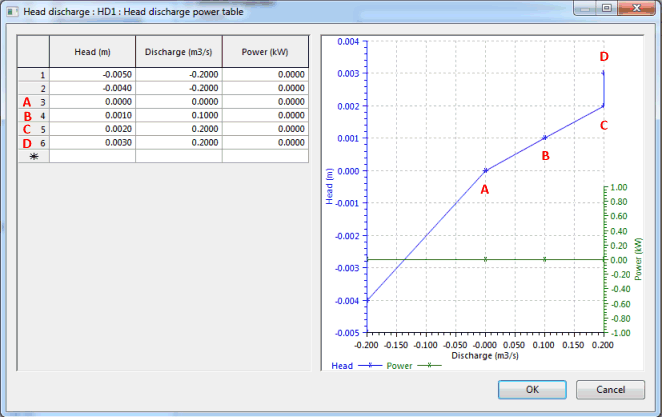
Figure 8 Head Discharge Table
In Figure 8 a head / discharge table called HD1 has been used to define the relationship between the water level above the ground surface and that below the ground surface.
The water level above the ground can be created from pooling in a flood cone, a water depth in the overland flow links or a combination of the two. The water level below the ground surface is measured in the manhole shaft or chamber.
There are two main situations to consider. First, where there are flows arriving at the manhole from the subcatchment or the above ground flow links and there is capacity available in the below ground sewer, but there is a limit to how much flow can enter the sewer imposed by the inlet. This situation is described as a limit of inflow. The second situation is where the water level in the below ground sewer rises and would flood out on to the catchment surface, but there is a limit to how quickly it can do this, again imposed by the inlet. This situation is described as a limit of outflow.
2.1 Limit of Inflow
The limit of inflow example is presented in Figure 9.
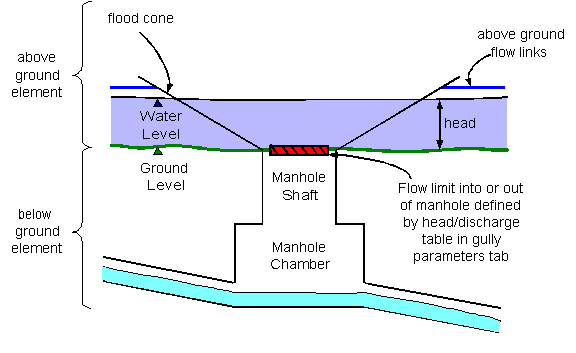
Figure 9 Limit of Inflow
From Figure 9 it can be seen that in the head / discharge relationship, the head is the difference between the water level in the above ground element (which is calculated in the flood cone and above ground flow links, dynamically, at each time step) and ground level.
The following description covers the four entries A, B, C and D shown in Figure 8.
A, B and C. As the water level rises above the ground level, the flow into the below ground sewer will increase, until there is a head of 0.002m above the ground level. At this head, the flow into the below ground sewer is defined as 0.2m3/s.
C and D. At a head of 0.003m, there is also a defined inflow of 0.2m3/s. Therefore 0.2m3/s is the maximum inflow that can enter this manhole.
2.2 Limit of Outflow
For a situation where the below ground sewer floods and flow would spill out on to the catchment surface, the below ground head is calculated in the same way as if the manhole was defined as 'sealed'. The water forms a narrow column of water above the ground surface. The cross sectional area of this column is equal to the minimum plan area at nodes defined in the simulation parameters (default = 1m2). Where the height of this column is greater than the depth of flow on the catchment surface or above ground flow links, it is described as a negative head. This is demonstrated in Figure 10.
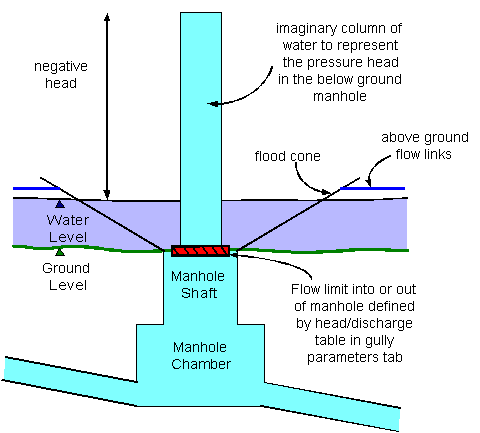
Figure 10 Limit of Outflow Example
It is possible to define the relationship between the negative head and the (negative) discharge out of the manhole in a very similar way to that shown in Figure 8.
3. Implementation of Equations Presented in HEC22 Manual
Five different types of inlet, presented in The HEC22 Manual (Reference 1) are implemented. These are:
- Continuous curb opening, described in Chapter 3.1
- Continuous grate, described in Chapter 3.2
- SAG curb opening, described in Chapter 3.3
- SAG grate, described in Chapter 3.4
- SAG combination (of grate and curb opening), described in Chapter 3.5
Examples of the curb, grate and combination inlets are shown in Figure 11.
The 'continuous' inlet types are appropriate in situations where water is flowing along the road, past the inlet. In these situations a flow / efficiency relationship is implemented. 'SAG' refers to a low point in the road, where the water will be standing rather than moving past the inlet. In these situations a head / discharge relationship will be implemented.
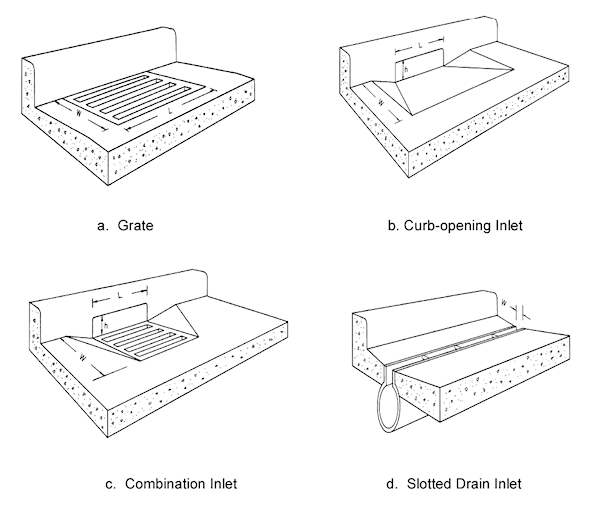
Figure 11 Types of Inlet
These examples are taken from the HEC22 manual, Reference 1. The slotted drain inlet is not implemented.
The 'continuous' inlet types are appropriate in situations where water is flowing along the road, past the inlet. 'SAG' refers to a low point in the road, where the water will be standing rather than moving past the inlet.
Note that the equations presented in this section are referenced in accordance with their equation number in The HEC22 Manual (Reference 1.)
Worked examples of these five equations are presented in Appendix A.
3.1 Continuous Curb Opening
The ratio of flow entering the sewer via the inlet is calculated from the equation:
|
|
where: E = Inlet Efficiency (expressed as a ratio) L = Length of curb opening LT = length of curb opening required for total interception of gutter flow (m)
LT is calculated from:
where: KU = 1.469 Q = Flow arriving at the inlet node d = depth at inlet (measured as over land level minus minimum (ground level, bottom storage level) Sx = Cross slope |
Note that equation 4-22a is used in preference to equation 4-22 (Reference 1) because equation 4-2 is used in the derivation of 4-22. Equation 4-2 is essentially Manning’s flow equation. However InfoWorks has an equivalent flow equation for the overland link, which is not necessarily based on Manning. Therefore equation 4-2 has been removed from 4-22 by eliminating SL0.5/n and substituting for T from equation 4-3.
This is a necessary approximation, but to work effectively, the cross section of the overland flow link must reflect the cross slope specified at the inlet. The overland link should have a cross-section similar to diagrams 1 or 2 of Figure 4-1 of the HEC22-Urban Drainage Design manual.
3.1.1 Depressed Curb Opening Inlet
Figure 12 shows a cross section of a depressed curb opening inlet, taken from Reference 1.
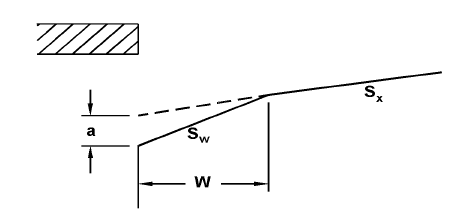
Figure 12 Depressed Curb Opening Inlet
Here Sx in equation (4-22a) is replaced with Se:
|
|
where: Se = Gutter slope S'w = a / W a = Gutter depression (m) W = Lateral width of gutter depression (m)
where: W = Width of grate (m)
where: T = Gutter Spread (m) |
For drowned forward or reverse flow, either drowned weir or orifice flow is used as for the Sag Curb-opening Inlet with a nominal opening height of 100mm.
3.2 Continuous Grate
The ratio of flow entering the sewer via the inlet is calculated from the equation:
|
|
where: Rf = ratio of frontal flow intercepted to total frontal flow E0 = ratio of frontal flow to total gutter flow Rs = ratio of side flow intercepted to total side flow
Rf, the ratio of frontal flow intercepted to total frontal flow, or frontal flow efficiency, is calculated thus:
where: Ku = 0.295 V = either DS Velocity or US Velocity in the overland link depending on which end is connected to the inlet node. (Note: if two overland links are connected to the inlet and have flow towards the inlet, V is the sum of such velocities from each of the overland links.) V0 = Velocity where splash-over first occurs (m/s). (Vo can be taken from chart 5A. This chart is only for the grates described on page 4-31 under section 4.4.3.) Note Rf cannot exceed 1.0
Rs, the side flow efficiency, is calculated thus:
where: Ku = 0.0828 L = Length of grate (m)
E0, the ratio of frontal flow to total gutter flow is calculated:
where: W = Width of grate (m) T = Gutter Spread (m)
T, the gutter spread, is calculated from:
where: d = Overland Level – min(Ground level, Bottom storage level).
Additional data The clogging factor (% Clogging) results in a % reduction in the inlet efficiency. It only affects the grate inlet. |
If the inlet is drowned or has reverse flow then the orifice equation from the Sag Grate Inlet is used with the open area taken as 0.8LW (a nominal reduction averaged over many inlet types). These situations are not considered in Reference 1.
3.3 SAG Curb Opening
The SAG curb opening covers three conditions. By default it acts as an weir, according to the equation:
|
|
where: Cw = 1.6 L = Length of curb opening (m) d = depth at inlet |
If there is an increase in slope adjacent to the curb opening, as shown in Figure 12 and a lateral width of gutter depression is specified then it acts as a depressed weir, according to the equation:
|
|
where: Cw = 1.25 W = Lateral width of gutter depression (m) |
If the depth at the inlet is greater than the user specified 'depth of water up to which inlet behaves as a weir (m)' then the flow into the sewer will be calculated according to the equation:
|
|
where: C0 = 0.67 H = Height of curb opening (m) |
It would seem sensible that the 'depth of water up to which inlet behaves as a weir' is set to the 'height of curb opening'.
3.4 SAG Grate Opening
The SAG grate opening can operate either as a weir or an orifice. It acts as a weir when the 'depth of water up to which inlet behaves as a weir (m)' is either not specified or greater than the depth at the inlet. When operating as a weir, it acts according to the equation:
|
|
where: Cw = 1.66 P = grate perimeter (not including the side in contact with the curb.) It is therefore: 2W + L |
When operating as an orifice, it acts according to the equation:
|
|
where: C0 = 0.67 Ag = Clear opening area of grate (m2) |
3.5 SAG Combination
The SAG combination can also act as either a weir or an orifice. When operating as a weir it uses equation 4-26, presented in section 3.4. When operating as an orifice it uses the following equation:
|
|
|
4. Flow Efficiency Relationship
In situations where water is flowing past an inlet (as opposed to standing, pooled water) it is appropriate to use a flow efficiency relationship. Where the inlet does not much one of the standard designs covered by the HEC22 Manual (Reference 1) is it possible to manually define a flow / efficiency relationship. This acts in a very similar way to the head / discharge relationship described in Chapter 2.
Appendix B describes a typical flow / efficiency relationship based on Spacing of Road Gullies (Reference 2).
The efficiency value is multiplied by the flow to obtain the flow entering the sewer.
|
|
|
5. User Defined Equation
Some practitioners (Reference 3 and Figure 12) specify an equation for inlets, which implements a head / discharge relationship. Examples are of the form:
Q/ P = 3.0y3/2
or
Q/ L = 3.0y3/2
where:
Q = flow
P = perimeter
L = curb opening length
Y = depth of flow at inlet
As perimeter and curb opening length are a constant for a given inlet, this can reduce to:
Q = ayb
where:
a and b = user-specified constants.
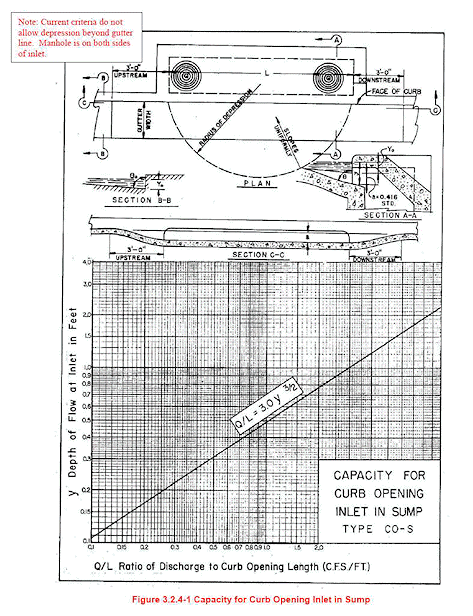
Figure 13 Example User Defined Equation
6. Understanding the Results
Whichever method of defining the inlet is chosen, there are two main situations to consider when analysing the results. The first is where the inlet limits the flow into the sewer. In other words there is flooding on the catchment surface whilst there is capacity in the below ground system. The second is where the inlet limits the flow out of the sewer. In other words the below ground sewer becomes pressurised.
6.1 Understanding Results, Limit of Inflow
Several additional result parameters are required because there are now two water levels in each manhole, one in the above ground element and one in the below ground.
Figure 14 shows an example where the inlet parameters presented in Figure 8 have been applied to node 100. In effect there is a limit of 0.2m3/s for flow entering node 100.
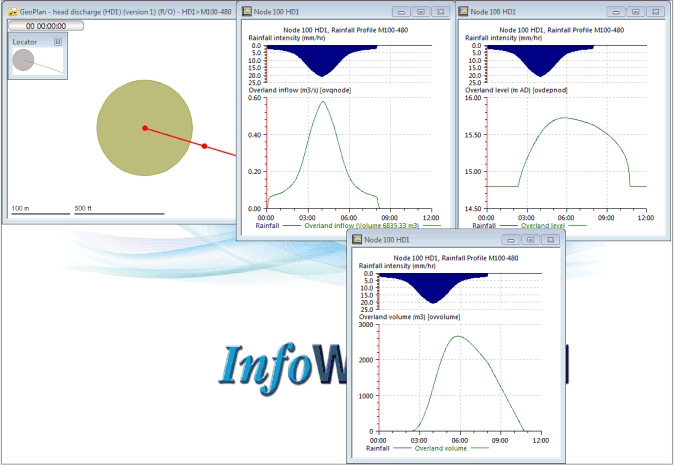
Figure 14 Limited Inflow Example, Above Ground Elements
The issues to note from Figure 14 are:
- 'Overland Inflow' represents the rate of flow arriving at the manhole. In this example the peak flow is about 0.6m3/s which is much greater than the maximum 0.2m3/s allowed through the gully.
- Overland Level represents the water level in the above ground element. From both the pick graph and the long section it can be seen that this is a maximum of about 15.7m.
- Overland Volume represents the flood volume in the above ground element. There is significant flooding, even though there is capacity available in the sewer due to the limit of inflow imposed by the inlet.
Figure 15 shows how the other parameters relating to the head discharge relationship are represented.
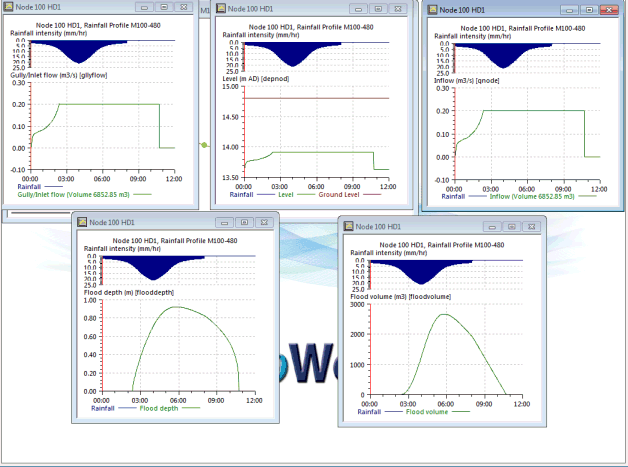
Figure 15 Limited Inflow Example, Other Result Parameters
- Gully/Inlet Flow represents the total flow through the inlet element. In this example it is a maximum of 0.2m3/s
- Inflow represents the total inflow to the manhole. In this example it is the same as the gully/inlet flow. This will not be true if there is a subcatchment of system type 'foul', 'sanitary' or 'other' applied to the manhole, because flows from subcatchments of these system types bypass the inlet.
- Level represents the level in the below ground element.
- Flood Depth represent the level in the above ground element relative to ground level.
- Flood Volume is the flooding in the above ground element, it is the same as overland flood volume. There cannot be any flooding in the below ground element, because this element is treated like a sealed manhole.
It is also possible to graph the 'efficiency' of an inlet for those types which implement a flow / efficiency relationship.
6.2 Limit of Outflow
Figure 16 shows a small catchment. Link 110.1 is undersized meaning that flow floods on to the surface from node 110. Node 110 has been defined as a inlet flood type with the characteristics shown in Figure 8. There is therefore a limit of flow from the manhole shaft on to the catchment surface of 0.2m3/s.
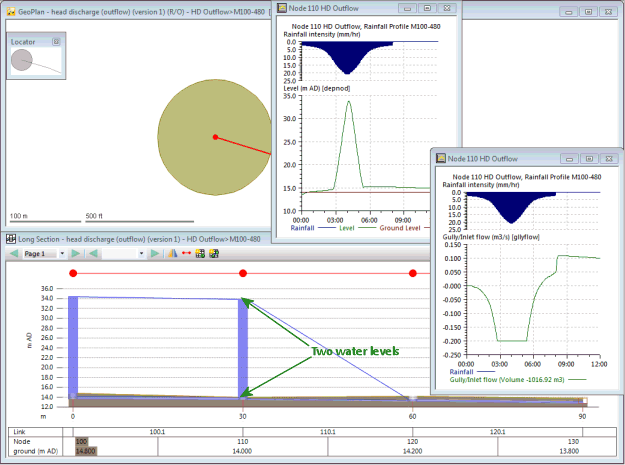
Figure 16 Limit of Outflow Results Example
From Figure 16 it can be seen that there are again two water levels shown in the long section. In this example the higher water level is from the below ground model. It is the (imaginary) narrow column of water which exists to represent the pressure head, as it does in a sealed manhole. The level in the below ground element is represented by the 'Level' graph also shown in Figure 15.
The negative flow rate from the below ground element on to the catchment surface is shown by the gully/inlet flow graph.
7. Discussion
The main question associated with inlets is of course "which method should be used?" It is suggested that if water is flowing freely along a road and past an inlet, then a flow efficiency relationship should be used. If the inlet falls into one of the standard HEC22 categories the relevant standard equation should be used, otherwise a user defined flow / efficiency relationship should be defined. If there is ponding at the inlet location and the water is effectively static (rather than rushing past the inlet) then a head discharge relationship should be applied.
Some of the equations include a depth at inlet term. This is significantly influenced by base flow depth, which by default is 5% of the pipe height. It is recommended that this default be reduced to the minimum amount necessary to retain model stability (which will be different in each case.)
Note that for the SAG grate and SAG combination inlets, there is likely to be oscillation as they move from the weir to the orifice equation. This transition is show in some of the examples in Appendix A. Models can go unstable at this point, especially if the change from weir to orifice flow occurs at a low depth.
References
- Urban Drainage Design Manual, Hydraulic Engineering Circular No. 22, Second Edition, Section 4, Pavement Drainage’, focusing on Section 4.4, Drainage Inlet Design.
- The Highways Agency. Design Manual for Roads and Bridges, Section 3, Spacing of Road Gullies. Report HA 102/00. November 2000.
- City of Fort Worth, Storm Water Management Design Manual. March 2006. http://www.fortworthgov.org/tpw/info/default.aspx?id=26178
Appendix A Worked Examples
The example shown in Figure 3 is used to demonstrate many of the inlet equations. The overland flow links are open channels (OREC shape) 5 m wide and 300 mm high.
An inflow hydrograph is applied to Node X of the model shown in Figure 3. This inflow hydrograph is presented in Figure A.A.
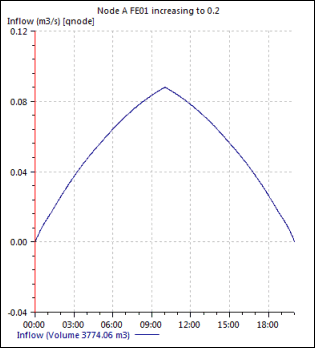
Figure A.A Inflow Hydrograph Used in Worked Example
The flows increase linearly from zero to a maximum of 0.2 m3/s after 10 hours and then decrease again.
In several of the examples, the depth at the inlet is an important parameter. It is therefore necessary to reduce the base flow depth to as low as possible, whilst maintaining stability, so ensure it does not significantly affect the results.
A.1 Continuous Curb Opening
L = 2 m (length of curb opening, defined in the inlet parameters)
Sx = 0.025 (this is manually defined as part of the inlet parameters and not measured from the characteristics of the overland links)
Q = 0.19989 m3/s (measured flow at 10 hours)
d = 0.030 m (measured at the upstream end of link A.1.)
Therefore:
LT = 8.57 m (Equation 4-22a)
E = 0.380 (Equation 4-23)
This matches the inlet efficiency at 10 hours shown in Figure A.B.
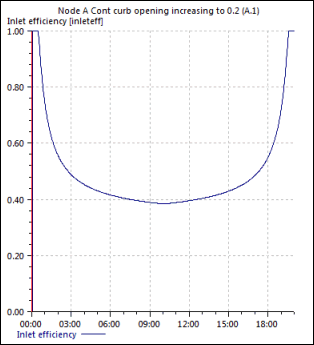
A.B Continuous Curb Opening Inlet Efficiency
A.2 Depressed Continuous Curb Opening
As continuous curb opening inlet worked example, except:
a = 0.2 m (defined in inlet parameters)
W = 0.5 m (defined in inlet parameters)
d = 0.036 m (measured at the upstream end of link A.1.)
Therefore:
T = 1.434 m (equation 4-3)
E0 = 0.6816 (equation 4-16)
Se = 0.2976 (equation 4-24)
LT = 28.222 m (equation 4-22a)
E = 0.1239 (equation 4-23)
This matches the inlet efficiency at 10 hours shown in Figure A.C.
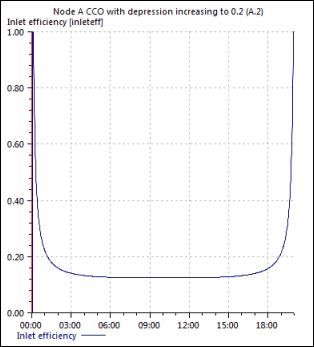
A.C Depressed Continuous Curb Opening Inlet Efficiency
A.3 Continuous Grate
V0 = 1.8 m/s (defined in inlet parameters)
Sx = 0.025 (defined in inlet parameters)
L = 0.91 m (defined in inlet parameters)
W = 0.5 m (defined in inlet parameters)
Ku = 0.295 (fixed value)
V = 1.104 m/s (measured at downstream end of link A.1)
d = 0.036 m (measured at downstream end of link A.1)
Therefore:
Rf = 1.0 (calculated from equation 4-18 as 1.205, but maximum value of 1.0 invoked)
Rs = 0.169 (equation 4-19)
T = 1.4482 (equation 4-3)
E0 = 0.6772 (equation 4-16)
E = 0.7318 (equation 4-20)
This matches the inlet efficiency at 10 hours shown in Figure A.D.
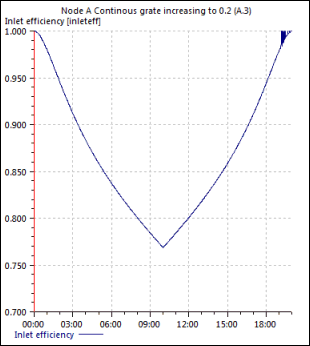
A.D Continuous Grate Inlet Efficiency
A.4 SAG Curb Opening (Weir)
CW = 1.6 (fixed)
L = 2 m (defined in inlet parameters)
d = 0.036 m (measured at downstream end of link A.1)
therefore:
Qi = 0.022 m3/s (equation 4-30)
This matches the inlet efficiency at 10 hours shown in Figure A.E.
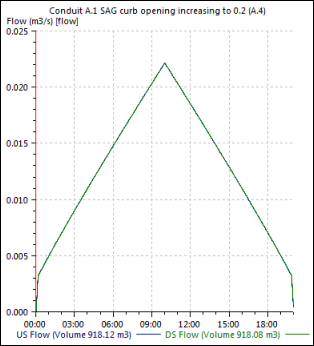
A.E SAG Curb Opening (Weir) Inlet Efficiency
A.5 SAG Curb Opening (Depressed Weir)
CW = 1.25 (fixed)
L = 2 m (defined in inlet parameters)
d = 0.036 m (measured at downstream end of link A.1)
W = 0.5 m (defined in inlet parameters)
therefore:
Qi = 0.025 m3/s (equation 4-28)
This matches the inlet efficiency at 10 hours shown in Figure A.F.
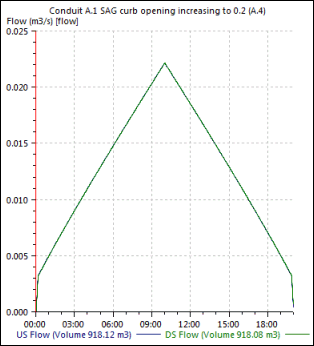
A.F SAG Curb Opening (Depressed Weir) Inlet Efficiency
A.6 SAG Curb Opening (Orifice)
C0 = 0.67 (fixed)
L = 2 m (defined in inlet parameters)
h = 0.05 (defined in inlet parameters)
d = 0.118 m (measured at downstream end of link A.1)
therefore:
Qi = 0.090 m3/s (equation 4-31b)
This matches the inlet efficiency at 10 hours shown in Figure A.G.
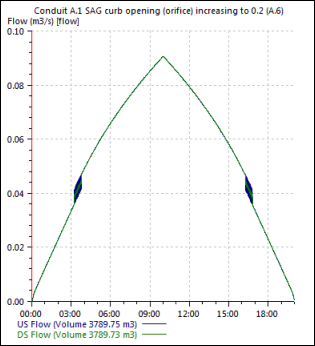
A.G SAG Curb Opening (Orifice) Inlet Efficiency
This flow chart shows some oscillation as it passes through 0.05 metres, which is specified in the inlet parameters 'depth of water up to which inlet behaves as a weir'. It would seem sensible that this value matches h, the user specified 'height of curb opening'.
Chart 9A of Reference 2 shows the head / discharge relationship for a range of perimeter (when the inlet is acting as a weir) and area (when it is acting as an orifice) values. It can be seen that there is a gap between these values when the head is about 0.3 m. This reflected the discontinuity (oscillation) in the InfoWorks results.
A.7 SAG Grate and SAG Combination Opening (Weir)
CW = 1.66 (fixed)
L = 1 m (defined in inlet parameters)
d = 0.1066 m (measured at downstream end of link A.1)
W = 0.5 m (defined in inlet parameters)
P = 2W + L = 2 m.
Sx = 0.025 (defined in inlet parameters)
therefore:
Qi = 0.106 m3/s (equation 4-26)
This matches the inlet efficiency at 10 hours shown in Figure A.H.
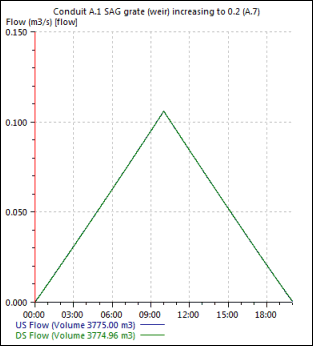
A.H SAG Grate and SAG Combination Opening (Weir) Inlet Efficiency
A.8 SAG Grate (Orifice)
CO = 0.67 (fixed)
Ag = 0.5 m (defined in inlet parameters)
d = 0.8045 m (measured at downstream end of link A.1)
W = 0.5 m (defined in inlet parameters)
Sx = 0.025 (defined in inlet parameters)
therefore:
Qi = 1.3257 m3/s (equation 4-27)
This matches the inlet efficiency at 10 hours shown in Figure A.I.
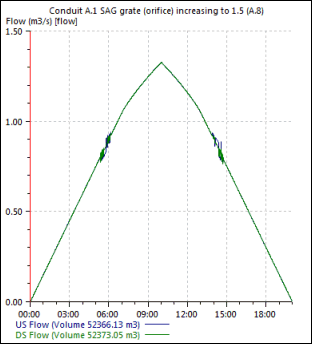
A.I SAG Grate (Orifice) Inlet Efficiency
Again there is an oscillation as the depth in the overland flow link pass through the 'depth of water up to which the inlet acts as a weir' at which point the weir equation (4-26) swaps to the orifice equation (4-27.)
A.9 SAG Combination (Orifice)
CO = 0.67 (fixed)
Ag = 0.5 m (defined in inlet parameters)
d = 0.6570 m (measured at downstream end of link A.1)
Sx = 0.025 (defined in inlet parameters)
L = 2 m (defined in inlet parameters)
therefore:
Qi = 1.4386 m3/s (equation 4-27 and 4-31b)
This matches the inlet efficiency at 10 hours shown in Figure A.J.
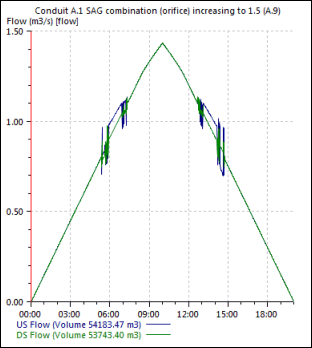
A.J SAG Combination (Orifice) Inlet Efficiency
Appendix B Advice on Flow Efficiency Relationship
If the inlet (gully) is of a type covered by HEC22 (Reference 1) it can be explicitly modelled by choosing the 'Inlet parameters' inlet input type and specifying the relevant inlet type. However some inlet types, particularly those in the UK are not covered by HEC22 and therefore a head / discharge or flow / efficiency relationship should be manually defined. This appendix gives advice on what that relationship should be, based entirely on Spacing of Road Gullies (Reference 2).
Reference 2 is a design manual used to calculate the spacing of road gullies under a single design flow. This appendix assesses Reference 2 and converts this design procedure into a formulae suitable for implementation in InfoWorks.
There are two elements to the limit of flow into and out of a gully. One is the pipe which connects the gully to the sewer and the other is the grating of the gully. The pipe connection is very simple and is discussed in Chapter B.1, the more complex grating is discussed in Chapter B.2.
B.1 Pipe Connection
Section 5.24 of reference 1 states:
'On steeper sections of road, the maximum allowable spacing between gullies may not be the determined by the collection efficiency of the grating but by the flow capacity of the gully pot beneath it. Experimental tests indicate that the maximum flow rate that can be accepted by a gully pot without surcharge is about 10 litres / second if the outlet pipe has a diameter of 100 mm and 15 litres / second if it has a diameter of 150 mm.'
B.2 Grating Design
The layout of a grating is presented in Figure B.A.
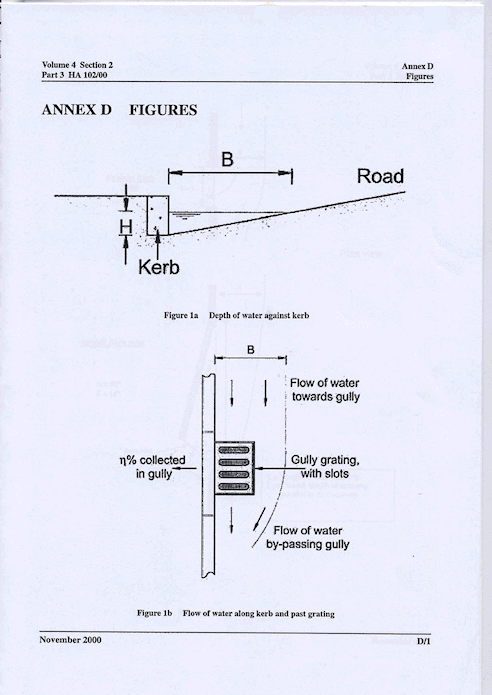
Figure B.A Gully Layout
Each grating has a defined efficiency:
|
|
where: E = grating efficiency G = grating parameter Note that reference 1 uses a rounded design value in calculations. Q = flow rate in channel approaching grating H = water depth against the kerb
where: Cb = grating bar coefficient defined in Reference 1, Table B1. = 1.75 for transverse bars and 1.5 for other bar alignments such as longitudinal, diagonal or curved. Ag = smallest rectangle parallel to the kerb that just includes all the slots. p = waterway area as a percentage of the grating area Ag
where: Af = cross sectional area of the flow R = hydraulic radius of the channel SL = longitudinal gradient n = Manning roughness coefficient
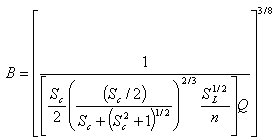
where: B = width of flow upstream of grating (See Figure 1) Af = BH/2 (Reference 1, equation 7) H = BSc (Reference 1, equation 6) where: Sc = Cross-fall of road |
Re-arranging equations 6, 7, 8 and 9, forms the equation:
|
|
|
Hence using equation 1 above and Reference 2 annex B and equation 6, the efficiency of a grating is a function of flow, cross fall, longitudinal slope and Manning's n.
A spreadsheet implementing these equations is available from the Innovyze support team.
A small test model was created in InfoWorks ICM to determine a typical peak discharge to a gully. The characteristics of the subcatchment are roughly based on Example 1 in Reference 2.
Area = 0.035 ha
Slope = 0.02
Runoff = 90% fixed
The model was simulated with a range of design storms and it was found that the peak runoff varied between 0 and 0.02 m3/s.
Flow efficiency was then calculated as a function of flow using the equations above and the parameters presented in Table B.1. The relationship is presented in Figure B.B.
Table B.1 Example Values
| Sc | 0.025 |
| SL | 0.01 |
| n | 0.02 |
| Cb | 1.5 |
| Ag (m2) | 0.12 |
| p | 50 |
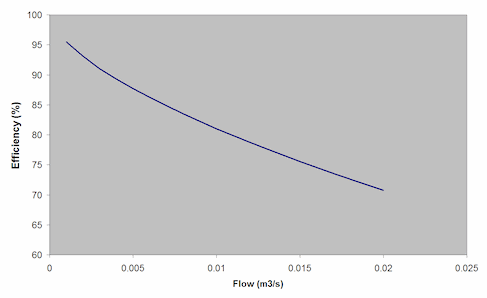
Figure B.B Indication of Relationship Between Flow and Grating Efficiency
Article © Innovyze 2012


