Grid Report (DMA Summary) view
This view provides details of failures that meet a defined minimum pressure criteria for a selected simulation.
The view is displayed by selecting , then completing the DMA Summary dialog , and then clicking the Produce Grid button. The fields displayed in the report will depend on the report options selected.
 Show image
| Item |
Description |
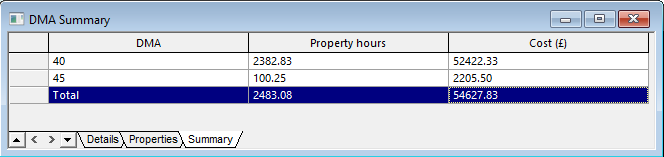
| Summary tab |
|
DMA
|
Demand Management Area (DMA) ID.
|
|
Property hours
|
Total number of property hours (Number of properties multiplied by the Duration) for a particular DMA.
|
|
Cost
|
Total cost (Property hours multiplied by the Cost per property hour) for a particular DMA.
|
|
| Properties tab |
|
DMA
|
Demand Management Area (DMA) ID.
|
|
Properties
|
Number of properties for a certain duration.
|
| Duration |
Total duration during the simulation when pressure dropped below the threshold. |
|
Property hours
|
Number of Properties multiplied by the Duration. |
| Cost |
Property hours multiplied by the Cost per property hour (specified in DMA Summary dialog). |
|
| Details |
|
Customer
|
Name ID of the customer where the Minimum Pressure Criteria is experienced. |
|
Start Time
|
Start time when the pressure is below the threshold as specified in the Minimum Pressure Criteria.
|
|
End time
|
End time when the pressure is below the threshold as specified in the Minimum Pressure Criteria.
|
|
| Context menu |
| Sort ascending/descending |
Allows you to sort the data in the report in ascending or descending order. |
| Export CSV report |
Allows you to export the report to CSV format.
|
| Select and find in GeoPlan |
Allows you to select and locate the affected properties in the GeoPlan.
|
|
| Column order |
You can change the column order by selecting a column and dragging it to a new position. If the position is valid, the dividing line between columns where the dragged column will be inserted is displayed as a thick grey line.
|
