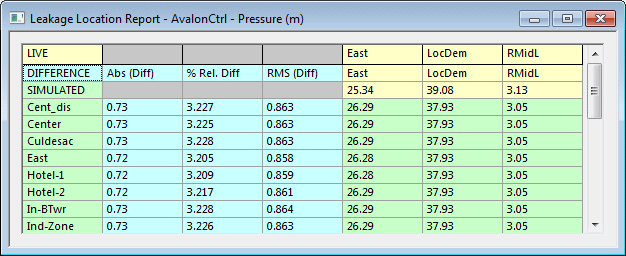
Leakage Location grid report
This report displays the results of leakage locator simulations. The report compares simulated and observed pressures at a selection of nodes.
The report is opened in one of the following ways:
- Open a leakage locator simulation.
- Right-click a leakage locator simulation, select Open as, then select Leakage locator report from the Selection dialog.
| Item | Description | ||||||||
|---|---|---|---|---|---|---|---|---|---|
| Live data (yellow) |
Each live data node is listed from the fifth column of the grid onwards. There are three entries for each live data node: name of node in the network, name of associated live data point, and live data pressure value at the time that leakage was applied (Test Time). If data is missing (because live data values could not be found), the relevant cells in the grid will be coloured red and contain the word Missing. If live data values have been interpolated, the live data pressure value will be coloured orange. |
||||||||
| Simulated values (green) | Each test node is listed from the fourth row of the grid. For each simulation, the left hand column lists the name of the node to which the leak was applied. Under each live data column, the simulated pressure for the test node is displayed. | ||||||||
| Summary differences (blue) |
Three difference scores for each row are displayed that can be used to rank the simulations in order of closeness of match:
Where: N is the number of live data observations (excluding missing ones) L is observed pressure value S is simulated pressure value |
||||||||
| Context menu |
|

