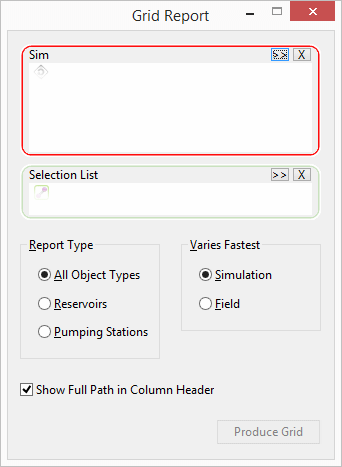
Grid Report (Non-Time Varying) dialog
This dialog is used to set up a grid report of non time varying results for one or more simulations.
The dialog is displayed when you choose Results | Grid reports | Non time varying results.
| Item | Description |
|---|---|
| Sim[ulation] |
For identifying one or more simulations to base the report on.
|
| Selection List |
You can reduce the scope of the report.
If a selection is not chosen, the report will be generated for the whole network. |
| Report Type |
The type of network objects to be included in the report. |
| Varies Fastest |
If you have more than one simulation selected, this option changes the order of the columns:
|
| Show Full Path in Column Header | Displays the full path of the simulation object in the graph column headers. If unchecked, displays the simulation name only. |
| Produce Grid | Generates the report. |

 (Browse) button to search
for a simulation.
 (Delete selection) button can be used to delete items from the
box.