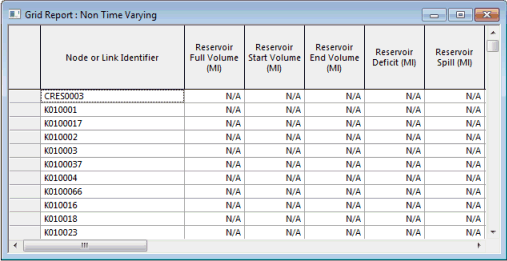
Grid Report (Non-Time Varying) view
This view displays fixed results (start and end results and maxima) for selected network objects. Each object has one row in the grid. Many of the columns will be inappropriate for some object types. In this case they will be marked N/A (not applicable).
The view is displayed by selecting Results | Grid reports | Non time varying results and then completing the Grid Report (Non-Time Varying) dialog.
| Item | Description | ||||||||||||||||||||||
|---|---|---|---|---|---|---|---|---|---|---|---|---|---|---|---|---|---|---|---|---|---|---|---|
| Columns for reservoirs |
|
||||||||||||||||||||||
| Columns for pumping stations |
|
||||||||||||||||||||||
| Other columns |
|
||||||||||||||||||||||
| Context menu |
|
||||||||||||||||||||||
| Column order |
You can change the column order by selecting a column and dragging it to a new position. If the position is valid, the dividing line between columns where the dragged column will be inserted is displayed as a thick grey line. |

