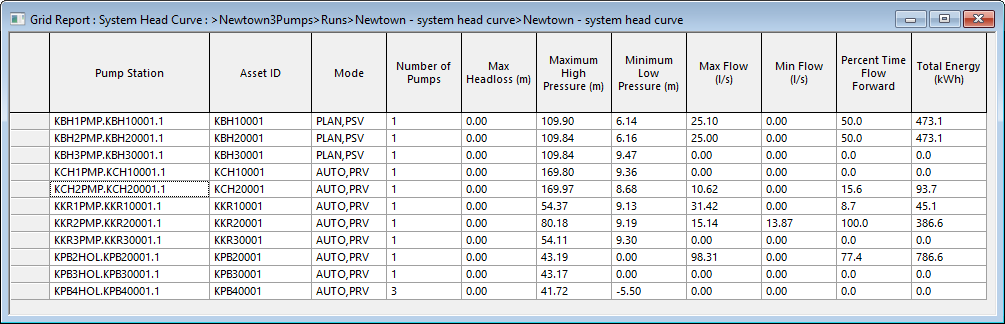
Grid Report (System Head Curve) view
The System Head Curve report provides basic information on the pumps for which system head curves are generated. The context menu allows you to display the pump station dialog, to view system head curves, and it allows you to find pumps in the GeoPlan.
| Item | Description |
|---|---|
| Pump Station |
The Pump Station where the System Head Curve is generated. |
| Asset ID | The Asset ID for the given Pump Station. |
| Mode | The Mode for the given Pump Station. |
| Number of Pumps | Number of pump units in pumping station. |
| Max Headloss | Maximum headloss value experienced during simulation. |
| Maximum High Pressure | Largest high pressure experienced at the Pump Station during simulation. |
| Minimum Low Pressure | Smallest low pressure experienced at the Pump Station during simulation. |
| Max Flow | Maximum volume of fluid that passes a point per unit. |
| Min Flow | Minimum volume of fluid that passes a point per unit time. |
| Percent Time Flow Forward | The percentage of time during the simulation that flow occurs in the forward direction. |
| Total Energy | Total energy used at Pump Station during simulation. |
