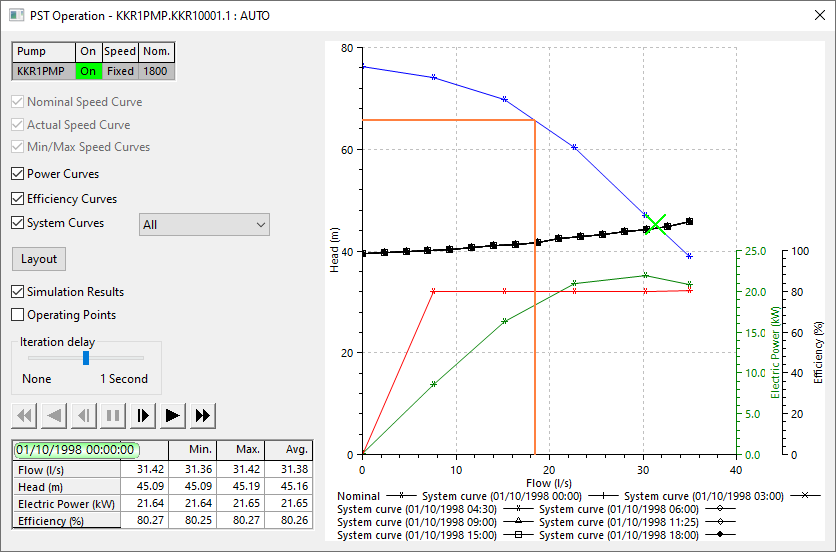
Pumping Station dialog
You can use this dialog to analyse the operation of a pumping station, including viewing
its behaviour during a simulation.
The dialog can be displayed in one of the following ways:
 Show image

| Item |
Description |
| Graph content options |
Options permanently available on the dialog that allow
you to control exactly what data is displayed:
|
Nominal Speed Curve
|
If checked, displays the head/ flow relationship for the pump at its
nominal speed (rpm). |
| Actual Speed Curve |
If checked, displays the head/ flow relationship at the current simulated speed
if it is different from the nominal speed (rpm). |
| Min/Max Speed Curves |
If
checked, displays the two curves corresponding to the user defined
minimum and maximum speeds (not necessarily achieved during the analysis).
|
| Power Curves |
If checked, displays the curves corresponding to the power used by operating the
pump in the various ways described above. |
| Efficiency Curves |
If checked, displays curves showing the derived efficiencies for the various
operating conditions described above. |
| System Curves |
Enables the display of System head curves.
The drop-down menu to the right allows you to display a particular curve, or all of them. The titles of the curves are given by the date and time of the run.
|
|
| Layout (button) |
Changes the layout of the dialog and graph. Several layouts are available by clicking the button repeatedly. |
| Simulation replay options and controls |
Additional options are added to the dialog if you open the report for
a pumping station in a completed simulation:
| Simulation Results |
If checked, displays the current operating point for the pump.
|
| Operating Points |
If checked, displays all the operating points for the pump during the simulation.
|
| Iteration delay |
Because
the dialog only replays data for the pump, instead of the whole network,
replay at full speed is too quick for realistic analysis. You can use this slide
control to set a sensible delay that allows you to see the behaviour clearly.
|
| Replay Control Buttons |
You can control the replay of the pumping station results in exactly
the same way as for the main simulation replay.
|
| Parameters Grid |
Shows
important values at the current timestep, along with minimum, maximum
and average values.
|
|
| Context menu |
| Print graph |
Opens a Print dialog, for printing the graph. |
| Copy graph |
Copies the graph into the clipboard. |
| Graph properties |
Opens the Graph Properties dialog. |
| Export traces to CSV |
Opens a Windows Save As dialog, for choosing a location and name of a CSV file to contain the graph trace data. |
| Print view |
Opens a Print dialog, for printing the view contained within the dialog. |
|

