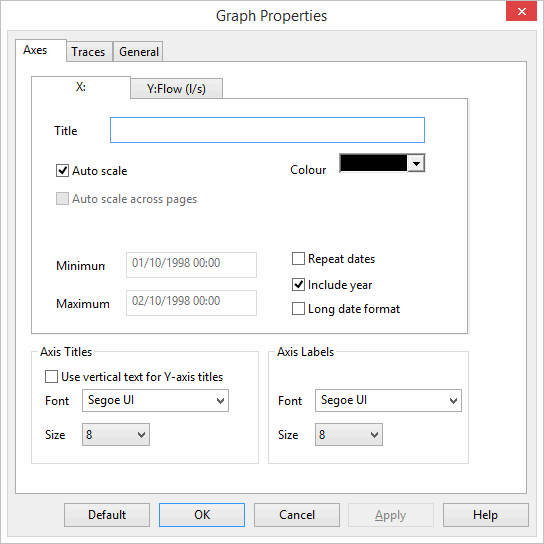
Graph Properties dialog
This dialog allows you to change the display properties of the graph.
The dialog is displayed by right-clicking the Graph view and choosing Graph properties, or by double-clicking the axis of interest on a graph.
| Item | Description |
|---|---|
| Axes page |
Allows you to change the labels, ranges, and other display options for the X and Y axes. Each separate axis has its own tab on the page. The decimal precision of both the X and the Y axis can be customised for scatter graphs, whereas only the decimal precision of the Y axis can be changed for other graphs. |
| Traces page | Shows the style for each trace on the graph. You can double-click a trace on this page to open the Trace Style dialog. |
| General page | Allows setting of a graph title, overall styles, and the display of live data flags. |
| Default button | Saves the current settings on the dialog as defaults for future graphs. Only generic settings are saved. For example, axis titles that may vary from one graph to another are not saved. |

