Demand Area Flow/Pressure page
This page is used to view the outputs of the Demand Area live data analysis as a graph. The graph is only populated when the relevant live data configuration file is open, along with the network and control.
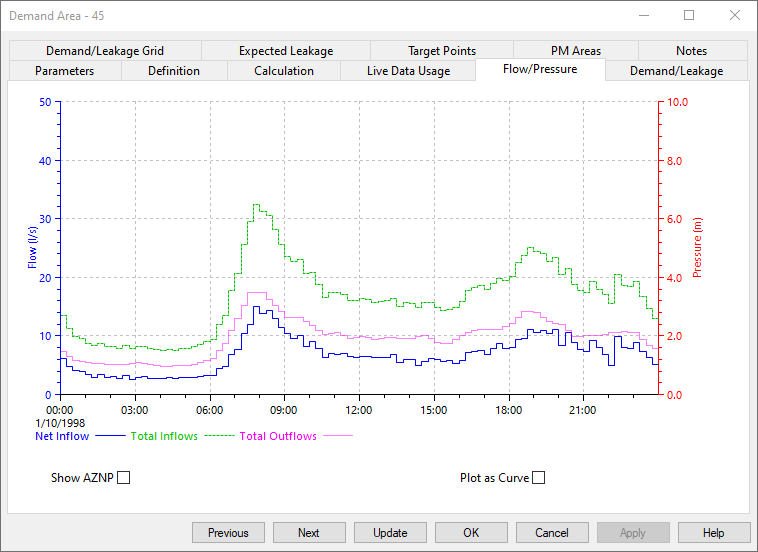
The graph shows the following:
- Total inflows into the Demand Area from transfer nodes, meters and pumping stations
- Total outflows from the Demand Area to transfer nodes, meters and pumping stations
- Total net inflow into the Demand Area
If a Demand Area or Pressure Managed Area AZNP node has been defined, pressures at these nodes can be displayed from simulation results and live data. Use the show AZNP drop down to switch between Demand Area and Pressure Managed Area AZNP nodes.
If Target Points have been generated on the Target Points Page , pressures at the Target Point nodes can be displayed from simulation results.
Graph Options
Graph properties can be edited and the graph can be printed or copied to the clipboard by right clicking the graph and selecting an option from the context menu:
- Print Graph - select this option to print the graph.
- Copy Graph - select this option to copy the graph to the clipboard for pasting into another application
- Graph Properties - select this option to edit graph properties such as axes titles and trace colours
