Transfer nodes allow you to model the flow of water between your network and other networks. The flow through the node can be set as a constant value, entered as a profile or linked to a live data point. This stage demonstrates the effect of changing the flow profile.
This stage assumes that you have started InfoWorks WS Pro and that the Model Group window is open, showing the Control Examples icon.
The tutorial dataset uses InfoWorks WS Pro native units (metric units). To import the tutorial data correctly, set the user units to metric by selecting Options from the Tools menu and clicking the Metric (Native) button on the Units tab.
To change the flow profile for a transfer node:
- Open the 'Newtown Controls Example' network.
- Open the Controls Base Control and associate it with the network to edit it.
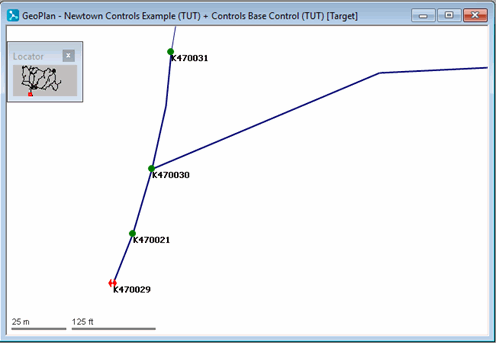
- Zoom in on the transfer node (K470029), which is in the south of the network.
- Display the properties for the transfer node:
- In the Flow Control section, the Flow Factor is shown as -1.00, indicating that water is exported from the network. (A positive value would indicate that water was imported into the network.)
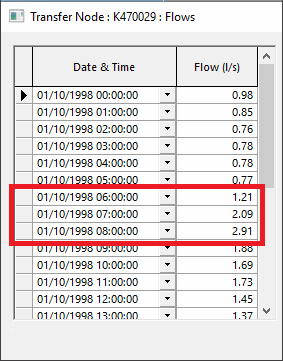
- Opening the Flows properties shows the flow out of the network at hourly intervals. The flow rate specified for any time is linearly interpolated.
- Change the profile for the peak flow period:
- Change the flow at 06:00 to 1.21 l/s, at 07:00 to 2.09 l/s and at 08:00 to 2.91 l/s.
- Click to close the Properties dialog.
- Commit the control data leaving a comment 'Controlling Transfer Node Flow'. Close the GeoPlan view.
- Run a simulation:
- Open the 'Pump Control 2' run from the Newtown Control Simulations group.
- In the box, change the title to 'Transfer Node Flow Control'.
- Drag the 'Controls Transfer Example' control item into the box.
- Click .
- When the simulation is complete, click the
 (Close dialog) button.
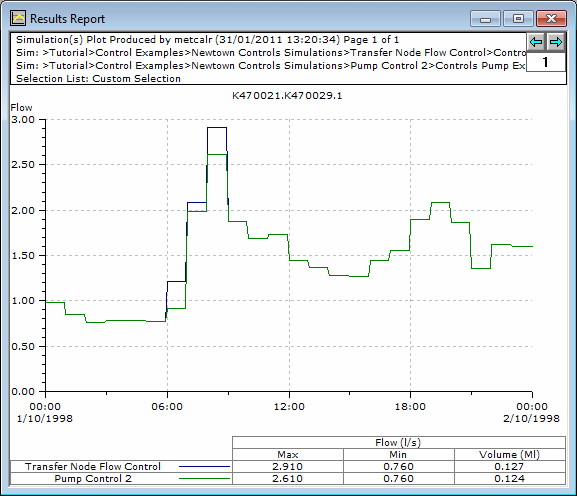
 - Compare the simulation results with the previous version:
- Open the simulation from the 'Transfer Node Flow Control' run.
- Select the pipe upstream of the transfer node.
- Select .
- Drag the Controls Pump Example 2 simulation from the Pump Control 2 run into the box (adding it to the current simulation).
- Click .
- Select for the display.
- Select for the location.
- Select for
the quantities.
- Click .
- A graph is displayed.
- Close all views.


