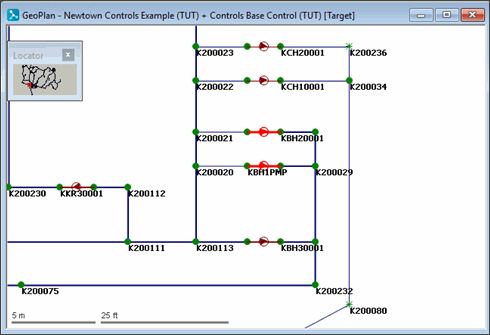
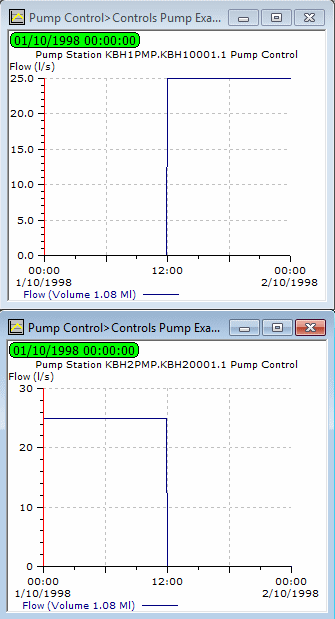
The network contains a number of pumping stations for pumping from boreholes. In particular, a pair of pumping stations (KBH1PMP and KBH2PMP) pump to a demand at K200029 and nodes to the south. One of these pumps is on for 24 hours, while the other is permanently off. You can change the pumping times so that the duty is split equally between them.
This stage assumes that you have started InfoWorks WS Pro and that the Model Group window is open, showing the Control Examples icon.
To change the pump controls:
- Open the Newtown Controls Example network.
- Open the Controls Base Control icon and associate it with the network to edit it.
- Zoom in on KBH1PMP.KBH10001.1 and KBH2PMP.KBH20001.1.
- Display the properties for the pumps:
- Select the
 (Properties) tool
and click a pump.
 - In the Pump Control section, the is shown as PLAN in each case. This mode allows you
to set the pumping times for the pump.
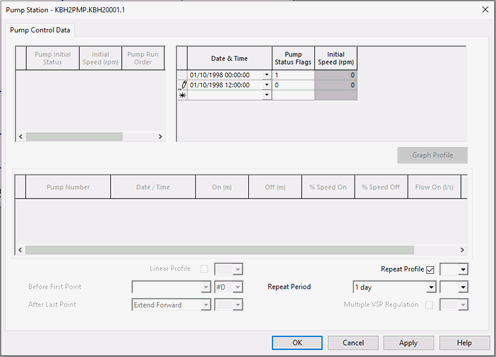
- The Pump Control Data section shows the initial status of the pump and the time at which the pump is switched on or off. Opening the Profiles property shows the is 0 when the pump is being switched off, or 1 when it is switched on. Currently, the pump at KBH1PMP is permanently on and KBH2PMP is off.
- Change the properties so that KBH2PMP is on for the first twelve hours only and KBH1PMP is on for the second half of the day:
- Select the
 (Properties) tool
and click the pump at KBH2PMP.
 - Open the Control Data properties, leave the value of "01/01/1998 00:00" in the top row of the Date & Time column (the date and time at which the pump status is to change).
- Enter a value of 1 for the Pump Status Flag on the right.
- Leave the values in the second row ("01/01/1998 12:00" and pump status flag set to 0).
- Display the properties for the pump at KBH1PMP. Open the Control Data sheet.
- For a date and time of "01/01/1998 00:00",
set the flag to 0; for "01/01/1998 12:00", leave the flag as 1.
- Commit the control data, leaving a comment 'Controls Pump Example 1'. Close the GeoPlan view.
- Run a simulation:
- Right-click the Newtown Control Simulations group and select .
- In the box, enter the title as 'Pump Control'.
- Drag Newtown Controls Example into the box.
- Drag the Controls Pump Example 1 item into the box.
- Drag the Profiles demand diagram into the box.
- Change the date and time to 1 October 1998 00:00 and the date and time to 2 October 1998 00:00.
- Change the Computational Accuracy to 0.5 l/s.
- Click .
- When the simulation is complete, click the
 (Close dialog) button.
 - View the simulation results:
- Open the simulation from the 'Pump Control' run.
- Use the
 button to display
graphs of flow for the pipes out of the pumping stations.
 - Minimise the GeoPlan.
- Tile the views horizontally.
- Close all views.
The next stage shows how pumps can be controlled automatically depending on the level in a reservoir.


