Extreme Value Analysis
The Extreme Value Analysis fits a statistical distribution to peak values when generating an Extreme Value Analysis custom graph. The peak values are determined from the simulation results and Episode Collection selected in the Custom Graph View when setting up the graph parameters.
There are four extreme value distribution options to choose from:
- Generalized Extreme Value
- Generalized Logistic
- Generalize Pareto
- Weibull
Scale, location and shape (a, x, k) parameters of the selected probability distribution function are estimated using the method of L-moments.
Method of L-Moments
The method of L-moments is similar to the method of conventional moments. Using the method of moments, statistical distribution is fitted by matching the mean, variance and skewness of the sample data to the moments of the distribution. However, this method is unreliable for data series that are strongly skewed. For skewed data the L-moment method is more suitable.
L-moments are based on linear combinations of ordered data values. Curve fitting is achieved by equating sample L-moments (l1 and l2) and L-moment ratio (t3) with corresponding expressions for distribution L-moments. See sections below for a summary of L-moment theory.
For further details on the Method of L-Moments see:
Sample L-moments
L-moments are estimated from linear combinations of probability weighted moments (Greenwood et al. 1979).
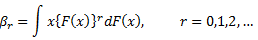
Probability Weighted Moments:
|
|
where: n = sample size Xj = jth element of sample data sorted in increasing order |
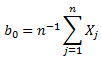
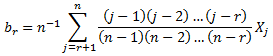
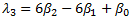
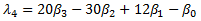
Sample L-moments are estimated by:
|
|
A measure of location, the first L-moment is identical to the usual mean:
The second L-moment is a measure of the spread of data, or scale:
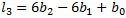
The third L-moment is a measure of the symmetry or skewness of data:
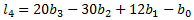
The fourth L-moment is a measure of the peakedness or kurtosis of data:
|


Dimensionless quantities known as L-moment ratios are obtained by scaling by I1 or I2:
|
|
L-CV:
L-skewness:
L-kurtosis:
|


Distribution L-moments
there are four distribution options to select from:
|
|
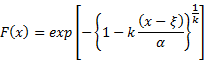
Generalized Extreme-Value:
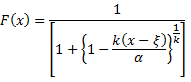
Generalized Logistic:
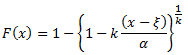
Generalized Pareto:
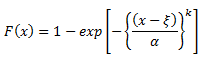
Weibull:
where: F(x) is the Cumulative distribution function |
Probability weighted moments are defined by:
|
|
|
Similarly to the sample L-moments, distribution L-moments are obtained from:
|
|
|


Similarly to the sample L-moment ratios, distribution L-moment ratios are obtained from:
|
|
|


