Horton Infiltration Model
Infiltration either on pervious surfaces or on semi-pervious surfaces can be directly modelled using a variant of the Horton equation. This is an empirical formula derived from infiltrometer/small catchment studies and is usually expressed as a function of time:
|
|
where: ¦0 is the initial infiltration rate (mm/hr) ¦c is the final (limiting) infiltration rate (mm/hr) k is the coefficient of the exponential term (1/hr) |
The cumulative infiltration (integration of Eq. 1 as a function of time) is given by:
|
|
|
The Horton equation, as defined above, represents the potential infiltration as a function of time when the supply rate (rainfall rate) is unlimited: that is, when the rainfall is higher than the potential infiltration rate. Expressed as a function of time, it is not suited for use in a continuous simulation model.
There are two methods, based on the Horton Infiltration Model, available in ICM, which differ in the way that continuous simulation is handled:
- Horton (InfoWorks network) / Modified Horton (SWMM network) : Infiltration is calculated as a function of soil moisture storage.
A description of the Horton method used in an InfoWorks network is described in the following section. The Modified Horton method used in SWMM networks is described in the SWMM5 Reference Manual, Volume 1 - Hydrology.
- HortonSWMM (InfoWorks network) / Horton (SWMM network) : Uses the method implemented in SWMM (Storm Water Management Model developed for the U. S. Environment Protection Agency). Instead of updating soil moisture storage, these versions of Horton find the point on the infiltration curve by comparing actual cumulative infiltration with equation (2) above. A full description can be found in the SWMM5 Reference Manual, Volume 1 - Hydrology.
You can choose which method of Horton to use for a InfoWorks network in the Runoff Surface properties while for a SWMM network, this can be set in the Model Parameters.
Horton (InfoWorks networks)
The Horton equation as defined in equation (2) above represents the potential infiltration as a function of time when the supply rate (rainfall rate) is unlimited: that is, when the rainfall is higher than the potential infiltration rate. Expressed as a function of time, it is not suited for use in a continuous simulation model.
As a result the equation has been transformed to be a function of a soil moisture storage which can be accounted continuously where:
|
|
where: q = soil moisture storage |
This final equation provides a direct mechanism for updating the Horton curve during a rainfall event if the rainfall intensity falls below the potential infiltration rate. Furthermore, it can be initialised as a function of soil moisture.
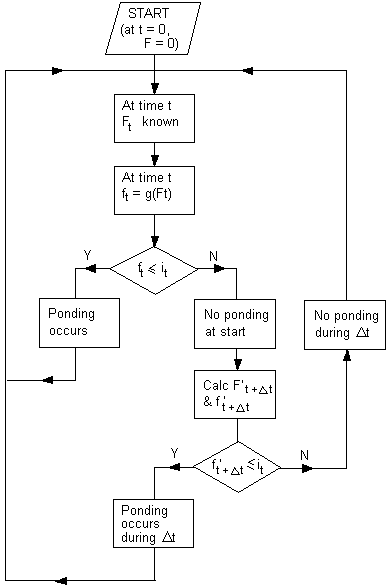
An overview of the calculations is provided in the diagram below. First, the infiltration rate at time t is calculated from Eq. 3. This value is compared with the supply rate of rainfall, i.

General flowchart for infiltration equation ft =(Ft)
If i > f then ponding occurs and the volume of rainfall losses due to infiltration is calculated directly from Eq. 2 over the time interval t.
If f > i then two cases can exist.
If f at the end of the interval t is greater than i, then all the rainfall infiltrates into the soil. If f at the end of interval t is less than i then ponding occurs during the interval t.
Calculating a new infiltration rate f tests the condition' at the end of interval t assuming all the rainfall i infiltrates.
If f' is greater than i then calculate the time to ponding tp.
Following this the rainfall from t to tp is allowed to infiltrate. A new f at time tp is calculated from Eq. 1. Infiltration volume is calculated from Eq. 2 substituting (t-tp) for t.
At the end of these calculations a new storage term is calculated.
Different values for Horton's infiltration model are available from the literature (see table below). It should be appreciated that values of fc as determined by infiltrometer studies are highly variable and can show an order of magnitude variation on seemingly similar soil types. Furthermore, the direct transfer of values as measured on rural catchments to urban catchments is not advised due to the compaction and vegetation differences associated with the latter surfaces.
Typical values for Horton's infiltration model
| SCS Soil Group | f0 (mm.hour) | fc (mm/hour) | k (1/hour) |
|---|---|---|---|
|
A |
250 |
25.4 |
2 |
|
B |
200 |
12.7 |
2 |
|
C |
125 |
6.3 |
2 |
|
D |
76 |
2.5 |
2 |

