Statistical Report View
The Statistical Report View displays the grids containing statistical results and associated summaries and queries.
The following grids are displayed:
Each exceedance or block spillage (available if the UK 12/24 block spill counting option was checked in the Statistics Template) is detailed on a separate row in the grid.
|
Field |
Description |
|---|---|
| AEP | Annual exceedance probability. |
|
Attribute Units ID |
Object attribute, attribute units and object ID as specified in the Statistics Template. |
|
Threshold <attribute> |
The Threshold value specified in the Statistics Template grid. |
|
Minimum integral |
The Integral value specified in the Statistics Template grid. |
|
Network Run Ensemble Sim / SWMM sim |
Name and version number of the network, run, ensemble and simulation results from which the statistical reports have been generated. |
|
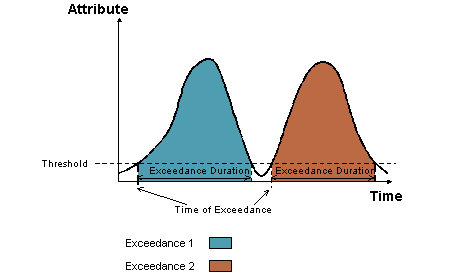
Start of exceedance (mins) Start of exceedance (Absolute) Exceedance duration (mins) |
Time of exceedance (mins) is the number of minutes into the simulation at which the exceedance starts, where the simulation uses relative time. Time of exceedance (Absolute) is the date and time at which the exceedance starts, where the simulation uses absolute time. Exceedance duration is the length of the exceedance.
|
|
End of exceedance (mins) |
The number of minutes into the simulation at which the exceedance ends, where the simulation uses relative time. |
|
End of exceedance (Absolute) |
The date and time at which the exceedance ends, where the simulation uses absolute time. |
|
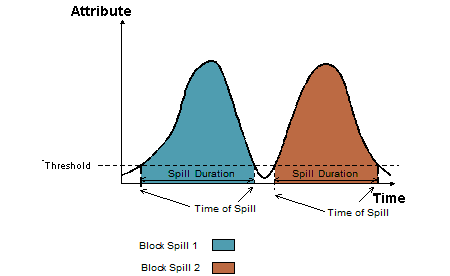
Start of spill (mins) Start of spill (Absolute) Spill duration (mins) |
Time of spill (mins) is the number of minutes into the simulation at which the block spillage starts, where the simulation uses relative time. Time of Spill (Absolute) is the date and time at which the block spillage starts, where the simulation uses absolute time. Spill duration is the length of the block spillage.
|
|
Peak <attribute> Time of peak (mins) Time of peak (absolute) |
Peak is the maximum value during the exceedance or maximum flow during the block spillage. Time of peak is the time at which the exceedance maximum or block spillage maximum occurs.
|
| Spill volume | The volume of spillage during the block spill duration. |
|
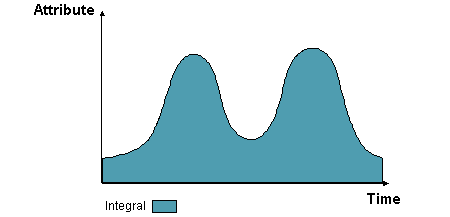
Exceedance integral |
Area under Attribute vs Time graph for individual exceedance.
|
|
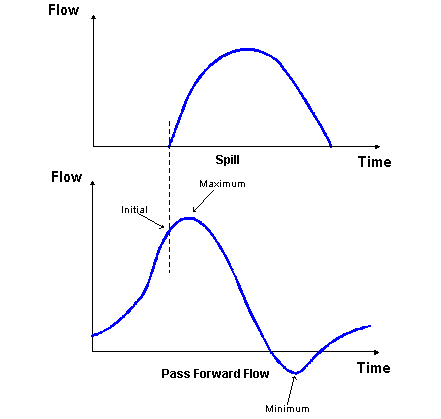
Pass forward link Initial pass forward flow Minimum pass forward flow Maximum pass forward flow |
The Pass forward link is the link specified in the Statistics Template grid.
The initial, minimum and maximum pass forward flows are identified as shown in the example below:
|
| Sim / SWMM sim ID | The database ID which uniquely identifies the simulation. |
| Custom columns | Descriptive text associated with object ID and Attribute as specified in the Statistics Template. |
There is a row in the grid for each Location / Attribute combination defined in the Statistics Template for each Simulation.
|
Field |
Description |
|---|---|
| AEP | Annual exceedance probability. |
|
Attribute Unit ID |
Object attribute, attribute units and object ID as specified in the Statistics Template. |
|
Threshold <attribute> |
The Threshold value specified in the Statistics Template grid. |
|
Minimum integral |
The Integral value specified in the Statistics Template grid. |
|
Network Run Ensemble Sim / SWMM sim |
Name and version number of the network, run, ensemble, and simulation results from which the Statistical Reports have been generated. |
|
Exceedance count |
The total number of exceedances over Threshold that occur during the Simulation.
Click on the image below to display an example for the total number of spills over threshold that occur during the simulation. Note: Number of exceedances will also be affected by the Combine events and Split long events options on the Stastistics Template View. |
|
Spill count |
The total number of block spills over Threshold that occur during the Simulation. |
|
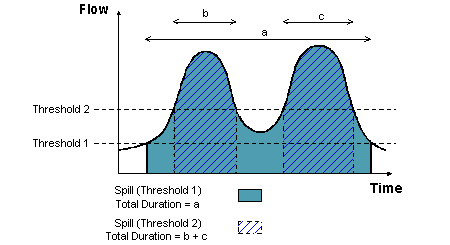
Total period of exceedances |
Sum of the time between the overall first and last times of spillage (threshold exceeded) within all the block spillages. Note that this is usually a larger value than the Total duration of exceedances as that corresponds to the total spillage time (i.e. sum of all durations where the threshold is exceeded) within all the spill blocks. |
|
Total duration of exceedances |
Sum of duration of Exceedances or block spillages over Threshold that occur during the simulation.
Click on the image below to display an example for the sum of duration exceedances of spills over threshold that occur during the simulation. Note: Number of exceedances and therefore Total duration of exceedances will also be affected by the Combine events and Split long events options on the Stastistics Template View. |
|
Total integral |
Sum of exceedance areas under Attribute vs Time graph.
Click on the image below to display an example of the sum of spill volumes throughout simulation. Note: Number of Exceedances and therefore Total integral will also be affected by the Combine events and Split long events options on the Stastistics Template View. |
| Sim / SWMM sim ID | The database ID which uniquely identifies the simulation. |
| Custom columns | Descriptive text associated with object ID and Attribute as specified in the Statistics Template. |
This grid does not contain any details about Exceedances.
|
Field |
Description |
|---|---|
|
Attribute Unit ID |
Object attribute, attribute units and Object ID as specified in the Statistics Template. |
|
Network Run Ensemble Sim / SWMM sim |
Name and version number of the network, run, ensemble and simulation results from which the Statistical Reports have been generated. |
|
Maximum <attribute> |
Maximum attribute value that occurs during simulation. |
|
Time of maximum (mins) |
Number of minutes into simulation at which maximum attribute value occurs (where simulation uses relative time). |
|
Time of maximum (absolute) |
Date and time at which maximum attribute value occurs (where simulation uses absolute time). |
|
Minimum <attribute> |
Minimum attribute value that occurs during simulation |
|
Time of minimum (mins) |
Number of minutes into simulation at which minimum attribute value occurs (where simulation uses relative time). |
|
Time of minimum (absolute) |
Date and time at which minimum attribute value occurs (where simulation uses absolute time). |
|
Simulation integral or Simulation volume (when reporting on flows) |
Total integral over simulation. i.e. areas under Attribute vs Time graph
|
|
Simulation duration |
Duration of simulation in minutes. |
|
Percentile 1-3 |
Percentiles to be calculated as specified in the Statistics Template. |
|
Percentile 1-3 value |
Attribute value at which roughly p% of attribute values during simulation are smaller and (100-p)% are larger. Where p% = Percentile as specified in the Statistics Template |
| Sim / SWMM sim ID | The database ID which uniquely identifies the simulation. |
| Custom columns | Descriptive text associated with object ID and Attribute as specified in the Statistics Template. |
