Statistics Templates
Statistics templates are used to specify the locations and attributes for which statistical summary data is to be produced. The summary data is displayed in Statistical Reports.
InfoWorks ICM statistics templates can also be used in the context of CSO monitoring and reporting in Infinity System. See Infinity System Configuration for more information.
To add a new statistics template, right-click on a Model Group, and select either New InfoWorks | Statistics template or New SWMM | Statistics template from the popup menu.
Existing statistics templates can be opened by right-clicking on the template and selecting Open. Note that a statistics template cannot be edited or deleted after it has been used to generate statistics.
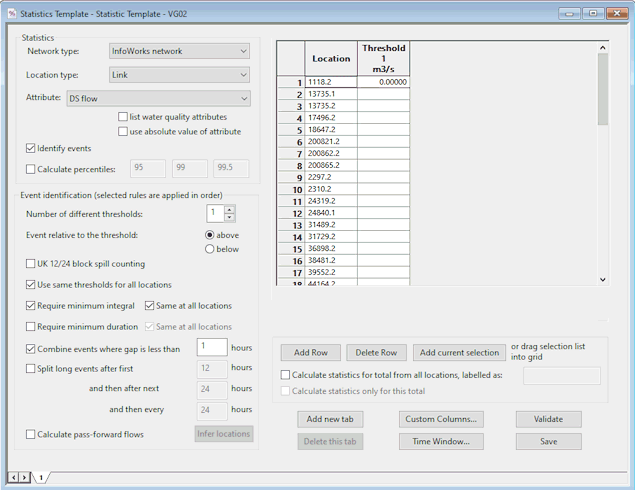
For each combination of Location type and Attribute, you can specify whether to report on events and/or percentiles. Up to three percentiles and up to three event thresholds may be defined. There are a number of rules which may be applied when reporting on events (see Event Identification Section below for more details). Selected locations are displayed in a grid.
In addition, a period of time (time window) or a set of regularly recurring time windows may be specified via the Time Windows Dialog. Data used to derive statistics will be restricted to those results which fall within the specified time window.
The items which comprise the statistics template are described in the following sections:
|
Field |
Description |
|||||||||
|---|---|---|---|---|---|---|---|---|---|---|
| Network type | A dropdown list of types of network. | |||||||||
|
Location type |
A dropdown list of types of locations applicable to the selected type of Network.
For InfoWorks networks, the following object types are available:
For SWMM networks, the following object types are available: |
|||||||||
|
Attribute |
Attributes applicable to the selected Location type. By default, water quality attributes will not be listed. For InfoWorks networks, adding a check to the list water quality attributes box displays a list of water quality attributes in the Attribute field, from which the applicable attribute can be selected. For SWMM networks, adding a check to the list water quality attributes box allows you to enter the name of the applicable pollutant, whose result attributes are to be included in the report, in the Attribute field. To use the absolute value of the chosen attribute, check the use absolute value of attribute box. |
|||||||||
|
Identify events |
A check in this box indicates that the calculation of Event (Exceedance) Statistics are to be included when producing a Statistical Report. (The Event Identification Section will become available). |
|||||||||
|
Calculate percentiles |
A check in this box indicates that the calculation of percentiles are to be included when producing a Statistical Report. Enter up to three percentiles to be calculated. |
The Event Identification Section is used to define the rules to be used when calculating Exceedance Statistics. The rules are applied in order.
As the most common use of the statistical reports will be for analysing outfall spills, the default values in the template are applicable to standard outfall spills.
|
Field |
Description |
|---|---|
|
Number of different thresholds |
Up to three thresholds may be defined in the Statistics Template Grid |
|
Event is the period above / below the threshold |
Radio buttons to select whether to report on events occurring above or below the threshold value defined in the Statistics Template Grid |
| UK 12/24 block spill counting |
Check this box to use the UK's Environment Agency's 12 and 24 hour block spillage method as the basis for calculating flow discharge statistics. InfoWorks ICM first looks for the first spill (threshold exceeded) and starts the first 12-hour block at its start time. If the total volume within that block is insignificant (less than the Integral specified in the Statistic Template Grid), InfoWorks ICM skips the current spill and then looks for the start of the next spill. When InfoWorks ICM has found a spill with a significant volume in the 12-hour block commencing at its start time, it reports the relevant statistical data, and then examines the following 24-hour block. If this 24-hour block has a significant volume, then it reports the relevant data, and considers the next 24-hour block and so on. When InfoWorks ICM encounters a 24-hour block with insignificant volume, then it restarts the entire process (i.e. looks for 12-hour block containing significant volume etc.) at the next spill with start time after the end of the last 24-hour block. |
|
Use same thresholds for all locations |
Check this box to use the same Threshold value for all objects in the Statistics Template Grid. When the box is checked only the Threshold value in the first row of the grid will be used (Threshold value cells in subsequent rows become blank and read only). When the box is unchecked, Threshold values for each location in the grid must be entered. |
|
Require minimum integral |
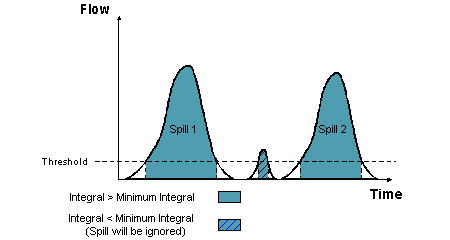
Check this box to define a minimum integral value in the Statistics Template Grid. Exceedances and block spills above/below the Threshold value that do not meet this minimum will be discounted as an event and will be ignored. |
| Require minimum integral - Same at all locations |
Check this box to use the same Integral value for all objects in the Statistics Template Grid. When the box is checked only the Integral value in the first row of the grid will be used (Integral value cells in subsequent rows become blank and read only). When the box is unchecked, Integral values for each location in the grid must be entered. |
|
Require minimum duration |
Check this box to define a minimum duration value in the Statistics Template Grid. Exceedances above/below the Threshold value that do not meet this minimum will be discounted as an event and will be ignored. This option is disabled if the UK 12/24 block spill counting box is checked. |
|
Require minimum duration - Same at all locations |
Check this box to use the same Duration value for all objects in the Statistics Template Grid. When the box is checked only the Duration value in the first row of the grid will be used (Duration value cells in subsequent rows become blank and read only). When the box is unchecked, Duration values for each location in the grid must be entered. This option is disabled if the UK 12/24 block spill counting box is checked. |
|
Combine events |
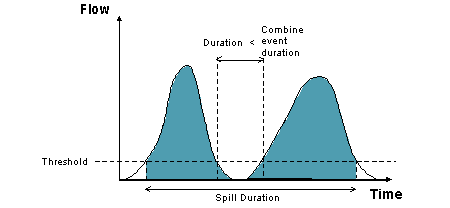
Check this box to combine events in cases where there is a short duration between events. Specify the duration in hours between events. Combined events are treated as one event in the Statistical Report.
This option is disabled if the UK 12/24 block spill counting box is checked. |
|
Split long events |
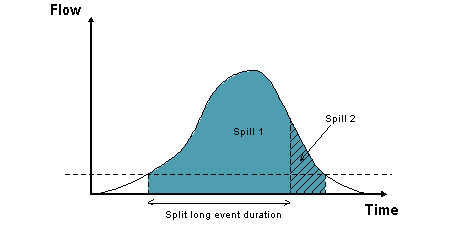
Check this box to divide long events into a number of events. Specify the duration in hours when an event should be split.
Note: Rules are applied in order and are not re-applied after a long event is split. Therefore it is possible that an event that has been split may be less than the minimum integral / minimum duration. This option is disabled if the UK 12/24 block spill counting box is checked. |
|
Calculate pass-forward flows |
Only applicable when analysing outfall spills. Click the Infer Locations button to automatically populate the Pass Forward Location column in the statistics template grid. |
The statistics template grid displays the objects to be reported on in the Statistical Reports. The grid can be populated in three ways:
- Drag a saved selection list into the grid
- Highlight a selection in the GeoPlan and click Add current selection
- Type in object ID into Location column
For InfoWorks networks, it is recommended that links which are selected for analysis should be modelled with a gauged timestep as opposed to a results timestep (see the Hydraulic Run View). This will improve the accuracy of the results.
The columns displayed in the grid will vary depending on the Event Identification rules selected.
|
Field |
Description |
|---|---|
|
Location |
Object ID |
|
Pass forward location |
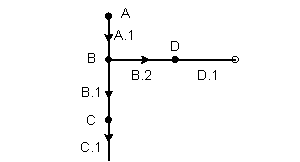
Click the Infer Locations button to automatically populate the Pass Forward Location. (See example below)
If D.1 is the Location, Infer Locations will search upstream from D.1 until a node with two outgoing links is found (node B). Link B.1 will be identified as the Pass Forward Location. If there is more than one possible pass forward location, the link with the lowest suffix will be chosen. Note: It is not possible to define two different pass forward locations relating to the same spill location in the same template. |
|
Threshold |
Attribute value (Constant y value on graph of attribute against time)
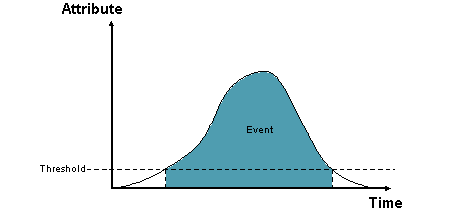
Event occurs when attribute value (e.g. flow) crosses Threshold line (if all Event Identification rules are satisfied) |
|
Integral |
Minimum Integral of an Exceedance or block spill. If the Integral of an Exceedance or block spill is less than the Integral value specified, the Exceedance will be discounted as an event and will be ignored.
e.g.
 Tips Tips A integral of 50 m3 would normally be used with the UK 12/24 block spill counting method. |
|
Duration |
Minimum Duration of an Exceedance. If the duration of an Exceedance is less than the Duration value specified, the Exceedance will be discounted as an event and will be ignored. |
| Custom columns |
Custom columns are used to add descriptive text to rows in the statistical report. Enter the text to be displayed in the report for each location. Addition of custom columns is managed using the Custom Columns dialog which is displayed by clicking on the Custom Columns button. |
Further Statistics Template Grid Options:
|
Field |
Description |
|---|---|
|
Add Row |
Appends a row to grid. |
|
Delete Row |
Deletes highlighted rows. |
| Add current selection |
Adds objects highlighted on GeoPlan to grid. |
| Calculate statistics for total from all locations, labelled as: |
A check in this box indicates that statistics are to be calculated for all objects in the grid as a group and the group in the Statistical Report should be labelled as the name entered in the box to the right. When this option is checked, a totals row will be appended to the statistics templates grid. The label specified will be displayed in the Location column of the grid. Only custom columns may be edited in the totals row. |
|
Calculate statistics only for this total |
A check in this box indicates that statistics are to be calculated only for the group defined in Calculate statistics for total from all locations only. Statistics for individual objects will not be calculated. |
|
Field |
Description |
|---|---|
|
Add new tab |
Adds a tab to the statistics template. This allows different Location Type and Attribute combinations to be defined in the same template. |
|
Delete this tab |
Deletes current tab. |
| Custom Columns |
Displays the Custom Columns dialog allowing the specification of additional custom columns to be displayed in the statistical report. Note that there is one Custom Columns specification per template. i.e. clicking on the Custom Columns button on any of the tabs in the template displays the same Custom Columns specification. |
|
Time Window |
Displays the Time Windows dialog allowing the specification of a time window or a set of regularly recurring time windows. Data used to derive statistics will be restricted to those results which fall within the specified Time Window. Note that there is one Time Window specification per template. i.e. clicking on the Time Window button on any of the tabs in the template displays the same Time Window specification. This button is disabled if the UK 12/24 block spill counting box is checked. |
|
Validate |
Carries out a validation of the statistics template. If there are errors present, an error log will be displayed. |
|
Save |
Saves the statistics template without closing the window. |
