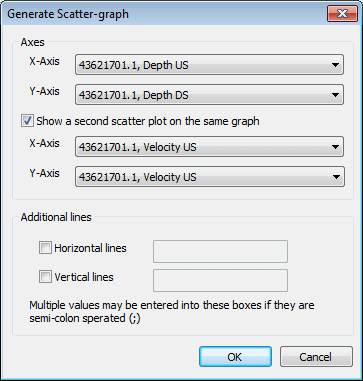
Generate Scatter Graph dialog

This dialog lets you create scatter graphs derived from the current Graph view.

The dialog is displayed if you right-click the Graph view and choose Create scatter graph. This menu item is available only if there is more than one sub-plot on the graph.

ClosedShow image

Item Description
Axes

You must select at least one pair of variables to display on the scatter graph. You can also display a second pair of variables on the same graph.

X-Axis Dropdown list of variables that can be displayed on the X-Axis of the scatter graph.
Y-Axis Dropdown list of variables that can be displayed on the Y-Axis of the scatter graph.
Show a second scatter plot on the same graph Displays a second pair of variables on the same graph. Enables the second set of X-Axis and Y-Axis dropdown lists.
X-Axis Dropdown list of variables that can additionally be displayed on the X-Axis of the scatter graph, in another colour.
Y-Axis Dropdown list of variables that can additionally be displayed on the Y-Axis of the scatter graph, in another colour.
Additional lines

You can add additional gridlines to the scatter graph.

Horizontal lines Adds one or more horizontal lines.

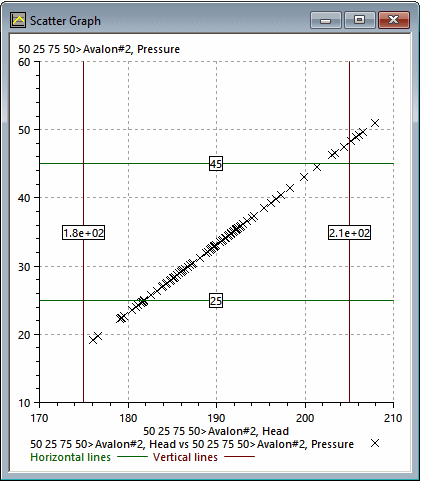
The lines will be drawn at the positions on the axes corresponding to the values you enter into the adjacent boxes. For example, if you want horizontal lines to be drawn across from values 25 and 45 on the Y-Axis, you would enter 25;45 in the box. Note that if the generated graph does not include axes with these values, you will not see the lines.

ClosedShow example of scatter graph with additional lines

The additional lines are at values 25 and 45 horizontally, and at values 175 and 205 vertically. Note how the additional lines are labelled.

Scatter graph with additional lines

Vertical lines Adds one or more vertical lines.

Generating scatter graphs

Changing graph properties

Using the Graph view