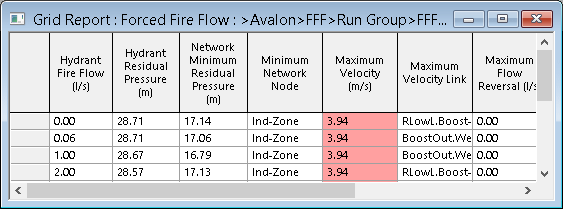
Grid Report (Forced Fire Flow) view
This view displays the results of a Forced
Fire Flow Simulation.
The view is displayed in one of the following ways:
- By dragging the base simulation result of a Forced Fire
Flow simulation onto the main workspace.
- By selecting and completing the Forced Fire Flow dialog.
If a failure criteria specified on the Fire
Flow Options dialog has not been met (Minimum Fire Flow Node Pressure,
for example), the appropriate field will be highlighted red in the grid.
 Show image

| Item |
Description |
| Forced fire flow results columns |
|
Hydrant Fire Flow
|
The test flow applied to the target node.
|
|
Hydrant Residual Pressure
|
The pressure at the target node after fire flow has been applied at
the node.
|
|
Network Minimum Residual Pressure
|
The minimum residual pressure in the network.
Note: Fixed Head, Well and Reservoir nodes are not included in the check
for Network Minimum Residual Pressure.
|
|
Minimum Network Node
|
The Node ID of the node at which the Network Minimum
Residual Pressure occurred.
|
|
Maximum Velocity
|
The maximum velocity experienced in the network at the snapshot for
which the Forced Fire Flow simulation is run.
|
|
Maximum Velocity Link
|
Link ID of the link in which the Maximum Velocity
occurred. If the Maximum Velocity occurs in the assumed hydrant pipe,
this will be indicated by the text "Hydrant".
|
|
Maximum Flow Reversal
|
The maximum flow reversal in the network (compared with base simulation).
|
|
Maximum Flow Reversal Link
|
Link ID of the link in which the Maximum Flow Reversal
occurred.
|
|
Hydrant Relative Head
|
A negative value indicates that pumping will be required.
The numerical value of the drop is derived by assuming that a standard
hydrant object is connected to the test node. Hydrant properties used
in the calculation are:
- Pipe diameter = min diameter of pipes attached
to the test node.
- Relative head = 0.0
- Local loss coeff = 1.0.
- Valve diameter = pipe diameter.
- Valve curve = PLUG
- Valve local loss = 1.0
|
|
| Context menu options |
| Copy |
Copies the value(s) of the selected cell(s) to the clipboard. Several cells / rows / columns can be copied simultaneously. |
| Freeze Columns |
Available from the column headers when one or more columns are selected.
Moves the columns to the left side of the grid, and marks them with an extra thick line. When you scroll columns sideways, these frozen columns do not move.
|
| Unfreeze All Columns |
Available from the column headers when columns have previously been frozen.
Unfreezes all frozen columns.
|
| Hydrant Curve |
Shows a graph of the calculated hydrant curve. |
| Show Results at Flow Value |
Shows a GeoPlan of results for a test flow. |
| Column sorting |
Various options to sort data in a single column or in selected rows / columns. |
|

