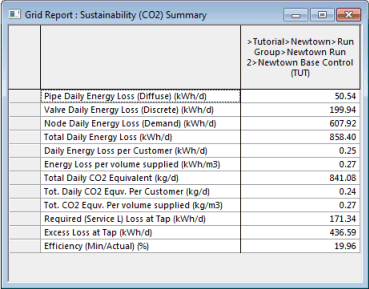
Grid Report (Sustainability CO2 Summary) view
This report displays a summary of sustainability analysis results for the network.
The report is opened by selecting and then completing the Grid Report dialog, choosing Sustainability (CO2) Simulation Summary as the report type.
 Show image

| Item |
Description |
| Column header |
Contains the full database location of the simulation (model group, run group, run, simulation). May also contain the title of the data in the column
as the final element. |
| Data |
|
Pipe Energy Loss (Diffuse)
|
Daily rate of energy loss in pipes due to friction and minor losses.
|
|
Valve Energy Loss (Discrete)
|
Daily rate of energy loss at control valves.
|
|
Node Energy Loss (Demand)
|
Daily rate of energy loss at nodes due to customer taps.
|
|
Total Energy Loss
|
Total daily rate of energy loss from pipes, valves and nodes.
|
|
Energy Loss per Customer
|
Daily rate of energy loss per customer.
|
|
Energy Loss per volume supplied
|
Rate of energy loss per unit volume of water supplied.
|
|
Total CO2 Equivalent
|
Total daily energy loss expressed as carbon dioxide equivalent.
|
|
Tot. CO2 Equv. Per Customer
|
Total daily energy loss per customer expressed as carbon dioxide equivalent.
|
|
Tot. CO2 Equv. Per volume supplied
|
Total daily energy loss per unit volume of water supplied expressed as carbon dioxide equivalent.
|
|
Required (Service L) Loss at Tap
|
Daily energy loss at customer taps assuming minimum service pressure entered on the Grid Report (Time Varying) dialog.
|
|
Excess Loss at Tap
|
Difference between Node Energy Loss (Demand) and Required (Service L) Loss at Tap.
|
|
Efficiency (Min/Actual) (%)
|
Water efficiency as a percentage calculated as:
Required (Service L) Loss at Tap / Total Energy Loss
|
|
| Context menu option |
| Copy |
Copies the value(s) of the selected cell(s) to the clipboard. Several cells / rows / columns can be copied simultaneously. |
|

