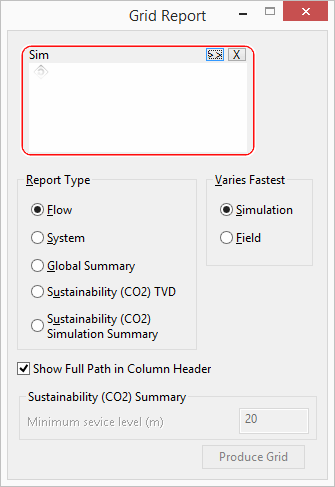
Grid Report (Time Varying) dialog
This dialog is used to set up a grid report of time varying results for one or more simulations.
The dialog is displayed when you select Results | Grid reports | Flow, system and global summary results.
| Item | Description |
|---|---|
| Sim[ulation] |
For identifying one or more simulations to base the report on.
|
| Report Type |
The type of report to be produced.
|
| Varies Fastest |
For a Flow or System report, if you have more than one simulation selected, this option changes the order of the columns:
|
| Show Full Path in Column Header | Displays the full path of the simulation object in the graph title box. If unchecked, displays the simulation name only. |
| Sustainability (CO2) Summary | For a Sustainability report, the Minimum service level box is enabled. Potential energy loss at customer taps is calculated assuming this head is met at the node. The energy loss at minimum service level is compared with the loss calculated during the simulation to provide an evaluation of water efficiency. |
| Produce Grid | Generates the report. |

 (Browse) button to search
for a simulation.
 (Delete selection) button can be used to delete items from the
box.