|
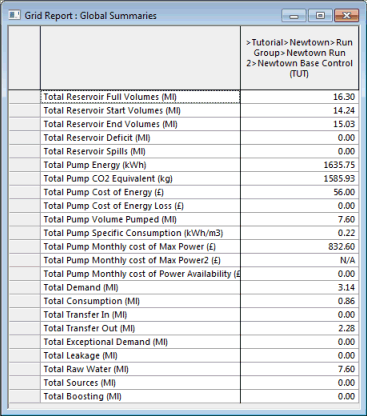
Total Reservoir Max Volumes
|
Sum of reservoir capacities.
|
|
Total Reservoir Start Volumes
|
Sum of volume of water in reservoirs at start of simulation.
|
|
Total Reservoir End Volumes
|
Sum of volume of water in reservoirs at end of simulation.
|
|
Total Reservoir Deficit
|
Applicable in cases where a reservoir(s) has emptied:
Sum of the total amount of water needed to maintain head at reservoir
bottom level during simulation for all reservoirs that have emptied.
|
|
Total Reservoir Spills
|
Applicable in cases where a reservoir(s) has overflowed:
Sum of the total amount of water that has overflowed from all reservoirs
during simulation.
|
|
Total Pump Energy
|
Sum of integrated pumping station power over time for all pumping stations.
|
|
Total Pump CO2 Equivalent
|
Total pump energy expressed as a carbon dioxide equivalent. See Sustainability Analysis.
|
|
Total Pump Cost of Energy
|
Pump Energy x Daily Rates Charge
Where:
Daily Rates Charge is defined on the Daily
Rates page of the Electricity Tariff.
|
|
Total Pump Cost of Energy Loss
|
Pump Energy Loss x Daily Rates charge
Where:
Daily Rates Charge is defined on the Daily
Rates page of the Electricity Tariff.
|
|
Total Pump Volume Pumped
|
Sum of volume of water pumped from all pumping stations during simulation.
|
|
Total Pump Specific Consumption
|
Total Pump Energy / Total
Pump Volume Pumped
|
|
Total Pump Monthly cost of Max Power
|
Sum of Maximum Cost results for all pumping stations in the network.
|
|
Total Pump Monthly cost of Max Power2
|
Sum of Maximum Cost 2 results for all pumping
stations in the network.
|
|
Total Pump Monthly cost of Power Availability
|
Sum of cost per month of Availability Rate of Power (Capacity Charge)
for all pumping stations. Calculated from:
Availability Rate of Power Charge x Max Power
Where:
Availability Rate of
Power Charge is defined on the Application
Dates & Fixed Costs page of the Electricity
Tariff
Max Power is
defined on the Pump Control page of the Pump
Station property sheet.
|
|
Total Demand
|
Total demand from the model. This is the sum of Total Consumption, Total
Transfer Out, Total Exceptional Demand and Total Leakage.
|
|
Total Consumption
|
The total demand* defined at nodes in the node demand grid on the Node Demand page.
*Demand profiles with the leakage option unchecked
in the Demand Diagram Editor.
|
|
Total Transfer In
|
Total flow into the system via transfer
nodes (Flow Factor = 1).
|
|
Total Transfer Out
|
Total flow out of the system via transfer nodes (Flow Factor = -1).
|
|
Total Exceptional Demand
|
Total demand at nodes defined as exceptional flow on the Exceptional
Flow Profile page.
|
|
Total Leakage
|
Total losses to the system. This is made up of the total leakage* defined
at nodes in the node demand grid and the Leakage
Loss, both defined on the Node Demand
page.
*Demand profiles with the leakage option checked
in the Demand Diagram Editor.
|
|
Total Raw Water
|
The total flow through pumping stations that have system role set to
RAW WATER. This parameter is set on the Pump Control
page of the Pump Station
property sheet or the Pumping Station Grid view
of the Links grid.
|
|
Total Sources
|
The total flow through pumping stations that have system role set to
SOURCE. This parameter is set on the Pump Control page
of the Pump Station property
sheet or the Pumping Station Grid view of
the Links grid.
|
|
Total Boosting
|
The total flow through pumping stations that have system role set to
BOOSTER. This parameter is set on the Pump Control
page of the Pump Station
property sheet or the Pumping Station Grid view
of the Links grid.
|

