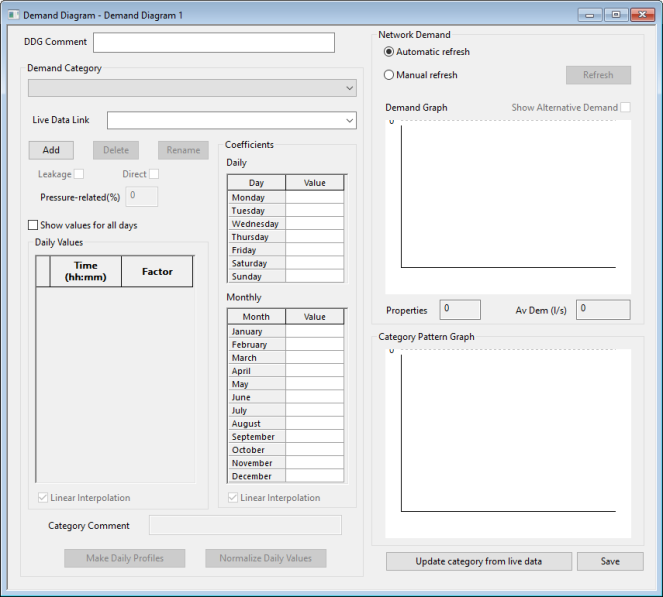
Demand Diagram dialog (demand diagram editor)
A demand diagram is a collection of individual demand categories which together describe the overall demand pattern for a supply area.
The demand diagram editor is used for both viewing and editing this demand pattern data.
To open a demand diagram for editing, either drag the demand diagram from the Model Group window onto the main window background, or right-click and choose Open.
Tip: An example demand diagram is supplied with the InfoWorks WS Pro example database. This can be copied to another database and altered if needed for use in your own projects.
| Data Field | Description | ||||||||||||||||||||
|---|---|---|---|---|---|---|---|---|---|---|---|---|---|---|---|---|---|---|---|---|---|
|
DDG Comment |
Space for comments applicable to the demand diagram. |
||||||||||||||||||||
| Demand Category
|
|
||||||||||||||||||||
|
|||||||||||||||||||||
|
|||||||||||||||||||||
| Network demand |
|
||||||||||||||||||||
|
Category Pattern Graph |
Displays a graph of the daily values entered in the Daily values grid for the selected category. |
||||||||||||||||||||
| Update category from live data | Opens the Update From Live Data dialog. |

