Demand Adjustment grid window
The Demand Adjustment grid window serves two purposes:
- it displays a summary of demand in the water supply model
- it allows adjustment of demand for individual demand categories or for the whole model
The Demand Adjustment view operates in conjunction with a network selection.
To display the view, choose Window | Grid windows | New demand adjustment window,
or click the  icon from the Grid windows dropdown on the Windows toolbar.
This view is network specific. There must be a current network.
Additional information will be displayed, and additional options will be available, if there is control data associated with the network and a current demand diagram.
The layout of the view
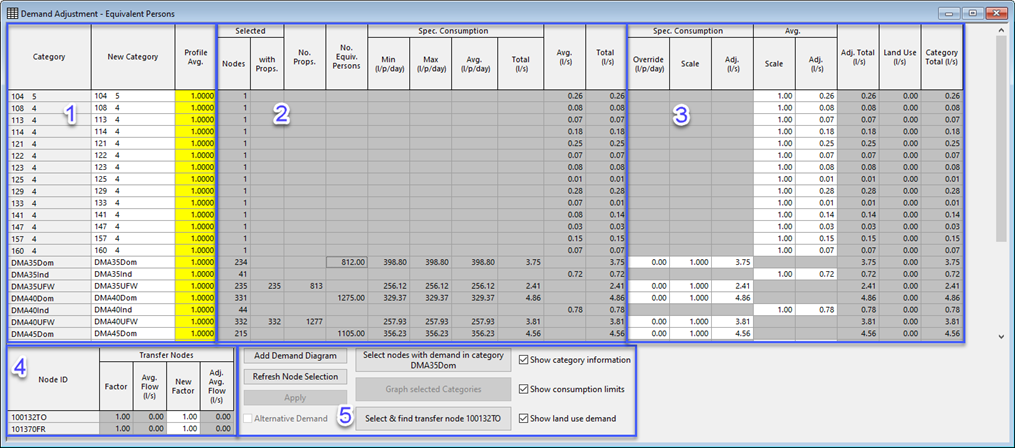
comprises five functional areas. ![]() Show image
Show image
| Area | Description | ||||||||||||||||||||
|---|---|---|---|---|---|---|---|---|---|---|---|---|---|---|---|---|---|---|---|---|---|
| 1 |
The left area of the view lists demand categories used by the nodes in the selection, with some additional rows for totals. If there is a current demand diagram, the New Category and Profile Avg. columns are populated with the actual values, allowing global changes to be made to the demand categories applied to particular nodes. Clicking a category in the New Category column will display a dropdown list with all the available demand categories, allowing you to assign a different category to these nodes. These categories are always displayed whether you have a current demand diagram attached to the view or not. However, if there is no current demand diagram:
Either open a demand diagram prior to opening the view, or open one and click the Refresh Demand Diagram button. If you have defined leakage categories, these are displayed separately from the demand categories. You can click the header rows for the two types to show or hide all the rows for that type. |
||||||||||||||||||||
| 2 | The central area of the view displays a summary of the current demand in the network. This summary will be updated every time adjustments from area 3 are applied. | ||||||||||||||||||||
| 3 |
The right area of the view allows demand to be adjusted in a number of ways described below. When changes have been made, you must click the Apply button to adjust demand settings in the network. The adjustment will be applied to all the selected nodes. Networks are version controlled objects: see Managing version controlled objects. Category Total is the sum of Land Use and Adjusted Total. Land Use demand is read-only (greyed out cells) indicating that it will not be affected by scaling. |
||||||||||||||||||||
| 4 | The lower left area of the view provides details of average flow through transfer nodes. The flow factor for transfer nodes can be adjusted if there is checked out control data associated with the network. | ||||||||||||||||||||
| 5 |
The lower right area of the view contains buttons and check boxes allowing object selection and customisation of the Demand Adjustment grid. Buttons:
Check boxes:
|
