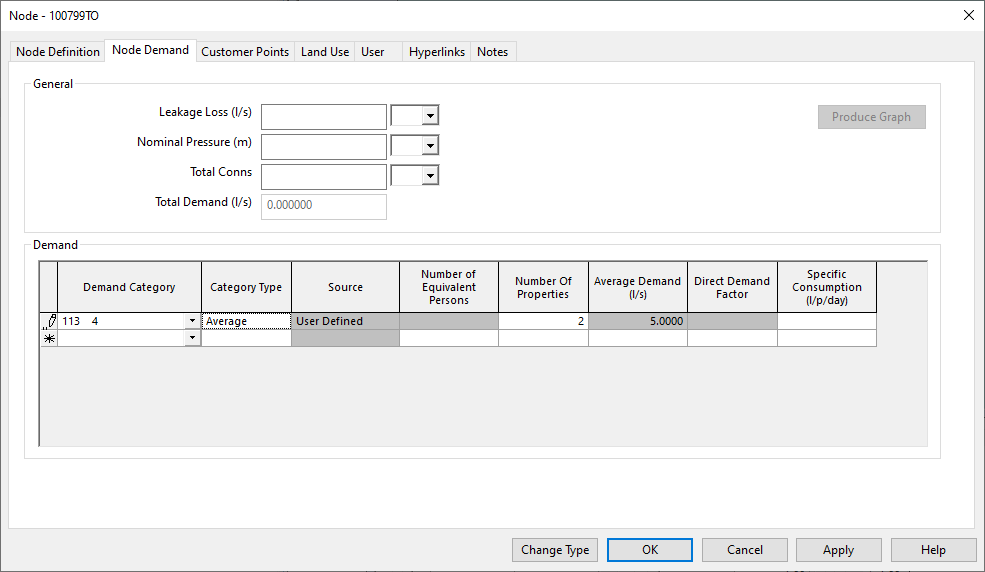
Node Demand page
Node Demand parameters can be viewed and edited on the Node Demand Page. This page can be used to set up demand at a node for specific demand categories. Graphs of demand at the node can also be drawn from this page.
It is possible to edit Node Demand parameters for all nodes using the
Demand at Nodes Grid View.
With the network open, click the  button on the Window toolbar. However, the Node
Demand Page is needed to draw graphs, or to use a Demand Category
more than once for the same node.
button on the Window toolbar. However, the Node
Demand Page is needed to draw graphs, or to use a Demand Category
more than once for the same node.
For more information on all node types, see Nodes. For more on the types of node using node demand, see Node, Reservoir and Hydrant.
Node Demand Grid
The Node Demand Grid contains details of customer point allocated demand and land use allocated demand and can also be used to edit manually allocated demand. See the Using the Node Demand Grid section on this page for more information about using the data fields in the grid.
Customer Point Related Demand Items
The grid on the Node Demand Page will automatically be populated with demand data from allocated Customer Points. Customer Point data appears in the top rows of the Node Demand Grid and is read-only (see Static Demand Allocation for detailed information).
Land Use Area Related Demand Items
The grid on the Node Demand Page will automatically be populated with demand data from allocated Land Use Areas. Land Use data is read-only (see Allocating Land Use Demand to Nodes and Calculation of Land Use Demand at Nodes for detailed information).
Graphing Demand
Select one or more Demand Categories in the grid (click the left hand cell of the row to select the row), and then use the Produce Graph button to display a graph of demand.

There must be a Current Demand Diagram before demand can be graphed (with two exceptions - see Special Demand Category Cases below).
![]()
This graph is displayed using the Demand At Nodes dialog.
If more than one row is selected in the grid, the graph shows the sum of all selected demands.
Special Demand Category Cases
The Demand Category is a 24 hour profile of demand for a particular type of consumer. The category will normally be defined in the Demand Diagram Editor.
There are two special Demand Category cases that can be used in the Node Demand Grid but are not defined in the Demand Diagram:
- CONST - a constant demand profile will be assumed
- CONST_LEAKAGE - a constant leakage profile will be assumed
General
| Data Field | Description | ||||||||
|---|---|---|---|---|---|---|---|---|---|
|
Leakage Loss |
Flow loss via leakage. Runs at a constant rate during the simulation. |
||||||||
|
Nominal Pressure |
Average pressure when using pressure related demand. The value of demand corresponds to standard service pressure - average pressure in normal circumstances. This parameter is used to state the likely value of service pressure for each node. If the pressure available at each node differs from its set value during the simulation, all demands will be changed accordingly (the lower the pressure, the lower the consumption or loss on the node). This adjustment of demand and loss is only activated when the Pressure Related Demand option is checked on the Schedule Hydraulic Run View when running a simulation.
Please Note
You are advised to experiment carefully with this option since it is dependent on accurate ground levels and working pressures. The feature has been included since it is obviously important in practice but with a warning to the user to proceed with care! Bear in mind that with the pressure-related demand option activated, total demand cannot be predicted accurately. InfoWorks WS has built-in relationships between pressure and consumption/loss. See the Pressure Related Demandtopic for further information. |
||||||||
|
Total Conns |
The number of customer connections attributed to node. This field can be automatically populated by using the Set Total Connections option from the Modelmenu. |
||||||||
|
Total Demand |
The total demand at a node averaged over 24 hours; calculated using the current Demand Diagram.
Please Note
The value reported in the Total Demand field will depend on whether a Demand Diagram is open, and whether demand categories assigned to nodes are present in the current Demand Diagram.
|
Using the Node Demand grid
Select the Demand Category by typing into the field or selecting a category from the dropdown list. The list will only be filled when there is a Current Demand Diagram. The demand for each Demand Category is defined in one of three ways:
|
Demand per Property |
Fill in the Specific Consumption and Number of Properties fields for the demand category. The Specific Consumption is the consumption defined as volume per property per day. This is multiplied by the Number of Properties to give total consumption per day
|
|
|
Average Demand |
Fill in the Average Demand box for the demand category. The Average Demand gives a value for the average across all properties in this demand category supplied over a time period, for example litres / second
|
|
|
Direct Demand |
Fill in the Direct Demand Factor box for the demand category. The Direct Demand Factor is a multiplier that can be used to adjust the values in the demand category. This demand type can be used when importing or entering data manually from recorded data. This value will normally be set to 1.0 unless the recorded data is to be adjusted.
Please Note
The value reported in the Total Demand field will depend on whether a Demand Diagram is open, and whether demand categories assigned to nodes are present in the current Demand Diagram.A Direct Demand factor should only be used with demand categories created as Direct demand. If a Direct Demand Factor is applied to a Factored demand category, it will be ignored. See Editing Demand Diagrams for more details.
Please Note
If the Direct Demand factor is zero or blank, no direct demand will be applied. A warning message will appear at validation informing the user that this demand will be ignored.
|
The Demand Category is a 24 hour profile of demand for a particular type of consumer. The Demand Category is defined by the user in the Demand Diagram Editor. the Monthly and Daily coefficients are also defined using the Demand Diagram Editor.
If the Category Type field is blank and the Number of Properties field is blank or zero, the value set for either Direct Demand or Average Demand will be used. If the Category Type field is blank and the Number of Properties is non-zero, the Demand per Property value will be used.
If relevant, click the icon in the units column to get information about units for the data item.
| Data Field | Description | Units | ||||||||||||||||||||||||||||
|---|---|---|---|---|---|---|---|---|---|---|---|---|---|---|---|---|---|---|---|---|---|---|---|---|---|---|---|---|---|---|
|
Demand Category |
The name of the Demand Category. If there is a current Demand Diagram, the dropdown list will be filled with the categories for the current Demand Diagram. Or you can type in a category name. There are two special Demand Category names:
|
N/A |
||||||||||||||||||||||||||||
|
Category Type |
The type of demand can be one of these types:
If this field is blank and the Demand Category is a factored category:
|
|
||||||||||||||||||||||||||||
|
Source |
Read only field for information. The value in this field will be one of the following:
|
N/A |
||||||||||||||||||||||||||||
| Number of Equivalent Persons | The number of equivalent persons in this category | N/A | ||||||||||||||||||||||||||||
|
Number of Properties |
The number of properties in this category |
N/A |
||||||||||||||||||||||||||||
|
Specific Consumption |
The consumption for each property/person in this category
|
See Changing the Display Units for information on how to display data in your preferred format. |
||||||||||||||||||||||||||||
|
Average Demand |
The average demand from this node for all properties in the category |
See Changing the Display Units for information on how to display data in your preferred format. |
||||||||||||||||||||||||||||
|
Direct Demand Factor |
A factor applied to a demand category created as Directdemand to adjust the demand category values.
Please Note
A Direct Demand Factor should only be used with demand categories created as Direct demand. If a Direct Demand Factor is applied to a Factored demand category, it will be ignored. See Editing Demand Diagrams for more details. The factor will normally be 1.0 |
N/A
|
