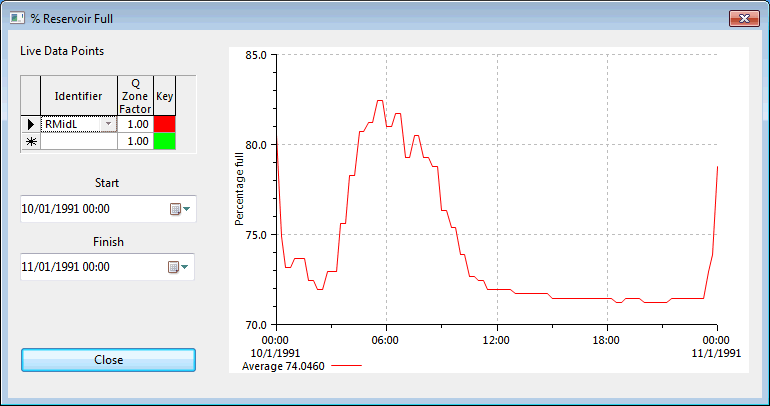
Percentage Reservoir Full dialog
This dialog is used to display a graph of percentage reservoir full.
The dialog is displayed by opening a network with associated control, right-clicking a live data point in the Live Data Point view that is associated with a reservoir in the current network, then choosing Graph % reservoir full.
| Item | Description | ||||
|---|---|---|---|---|---|
| Live Data Points | A grid reproduced from the Live Data Point view. | ||||
| Start | Sets the start time of the timescale shown on the graph. | ||||
| Finish | Sets the finish time of the timescale shown on the graph. | ||||
| Graph display area |
|
