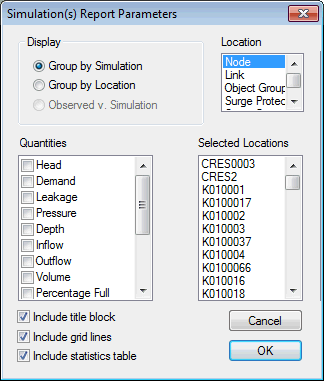
Simulation Report Parameters dialog

This dialog is used to choose the parameters displayed in the graph report. The report will be displayed in the Graph view.

The dialog is opened by selecting Results | Graph reports | Simulation(s) report, then clicking Produce Graphs on the Simulation(s) dialog.

ClosedShow image

Tip: See Displaying simulation graph reports for more information.

Item Description

Display

This decides in what order the details are displayed.

Group by Simulation

This option will be available if a selection list has been entered in the Simulation(s) dialog.

Each simulation is shown on a different page.

On each page there is a graph drawn for each parameter chosen from the quantities list.

There is a trace on each graph for every network object listed in the selected locations list.

Note: InfoWorks WS Pro can plot a maximum of ten traces on a graph. If there are more than ten selected objects, InfoWorks WS Pro will display an error message and display graphs for the first ten objects in the Selected Locations list.

Group by Location

This option will be available if a selection list has been entered in the Simulation(s) dialog.

Each location (network object) listed in the selected locations list is shown on a different page.

On each page there is a graph drawn for each parameter chosen from the quantities list.

There is a trace on each graph for every simulation listed in the Simulation(s) dialog.

Note: InfoWorks WS Pro can plot a maximum of ten traces on a graph. If there are more than ten simulations you will only see traces for the first ten.

Observed v Simulation

This option will be available if a live data configuration has been entered in the Simulation(s) dialog.

Each location (network object) linked to live data is shown on a different page.

If a selection list has also been entered in the Simulation(s) dialog, only the selected locations are shown.

On each page there is a graph drawn for each parameter chosen from the quantities list.

There is a trace on each graph for every simulation listed in the Simulation(s) dialog and for the live data associated with the simulation.

Quantities

Select the quantities you want to graph. Only valid quantities are listed.

Location

You can choose either all the nodes in the selection or all the links in the selection, but not both.

Selected Locations

This is a read-only list of the selected locations.

Note: The graph tool can display only ten different traces per graph. If you have selected more than ten network objects, you will see a warning, and InfoWorks WS Pro will display data only for the first ten objects in this list.

Include title block Includes the stated item in the graph report.
Include grid lines
Include statistics table
OK

Generates the graph report.

If there are problems with the graph request, the dialog will expand and list the errors. For example, when viewing observed versus simulation data, the model may contain pointers to observed data that doesn't exist in the live data. You will be given the option to continue or quit.


Displaying simulation graph reports