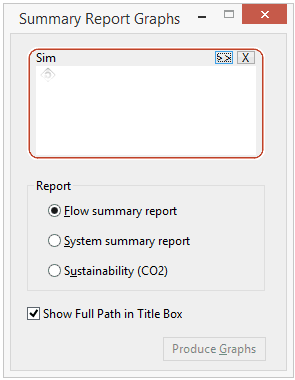
Summary Report Graphs dialog
This dialog is used to display a Flow, System or Sustainability Summary graph report.
Tip: See the Displaying summary report graphs topic for details of the content of the reports.
The dialog is displayed by selecting Results | Graph reports | Flow & system summary report.
| Item | Description |
|---|---|
| Sim[ulation] |
For identifying one or more simulations to base the report on.
|
| Report |
The type of report to be produced.
|
| Show Full Path in Title Box | Displays the full path of the simulation object in the graph title box. If unchecked, displays the simulation name only. |
| Produce Graphs | Generates the report. |

 (Browse) button to search
for a simulation.
 (Delete selection) button can be used to delete items from the
box.