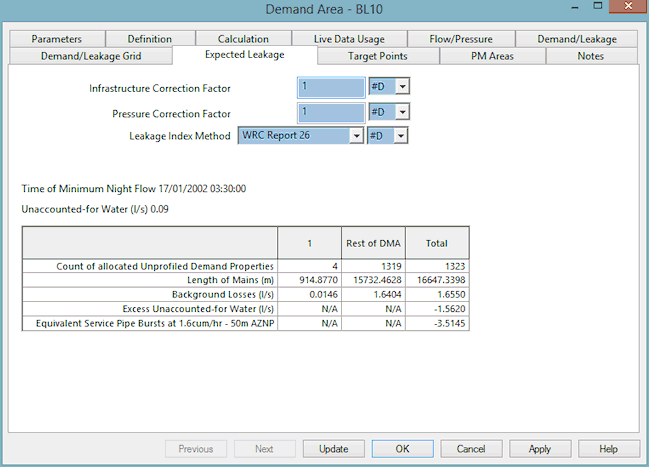
Demand Area Expected Leakage Page
The Expected Leakage Page is used to view and edit the parameters of the expected leakage calculation and to view the results of the calculation.
Infrastructure Correction Factor
The Infrastructure Correction Factor (ICF) is a factor which indicates the relative condition of the mains (Managing Leakage (Report F) - Using Night Flow Data.) The expected range is between 0.1 and 2 where:
| ICF | Condition |
|---|---|
|
0.5 |
Good |
|
1 |
Average |
|
1.5 |
Poor |
Pressure Correction Factor
The Pressure Correction Factor (PCF) is a factor which is used to correct the AZNP to a standard 50m . The expected range is between 0.1 and 3. (Managing Leakage (Report F) - Using Night Flow Data).
If a default value is chosen the value of the PCF will be calculated according to the Leakage Index Method chosen.
The value for AZNP is taken from live data where available, otherwise simulation results will be used.
Leakage Index Method
There are two Leakage Index methods available: WRC Report 26 (default) and 1.5 Power Law.

PCF can only be calculated if an AZNP has been specified or calculated on the Parameters Page of the Demand Area Property Sheet. If there is no AZNP available for use in the calculation the PCF will default to a value of 1.
WRC Report 26
Using the WRC Report 26 method the PCF is calculated using:
|
|
where Leakage Index is calculated by:
AZNP = Average Zone Night Pressure |
1.5 Power Law
Using the 1.5 Power Law the PCF is calculated using:
|
|
|
Background Losses
Background Losses are calculated using the method described in A Manual of DMA Practice (1999):
|
|
where:
ICF = Infrastructure Correction Factor PCF = Pressure Correction Factor 
Please Note
LB is calculated as l/hr and then converted to user units for reporting purposes. |
Equivalent Service Pipe Bursts
Equivalent Service Pipe Bursts are calculated using the method described in A Manual of DMA Practice (1999):
|
|
where:
Excess UFW = Excess Unaccounted For Water:
Median Service Pipe Burst Flow Rate:
AZNP = Average Zone Night Pressure 
Please Note
Equivalent Service Pipe Bursts can only be calculated if there is live data associated with the AZNP node, or if there are simulation results open in the GeoPlan. |

 m
m