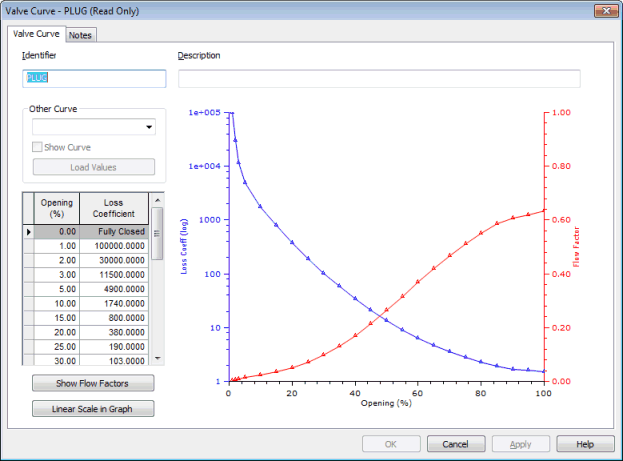
Valve Curve page
Allows you to view and edit data fields shared for a Valve Curve. Details of all the fields displayed can be found in Valve Curve Data Fields.
InfoWorks WS contains typical built in curves for ball, butterfly, gate, needle and plug valves. A default float valve curve is also included.
Information about the valve curves is displayed in the Valve Curve Grid View of the Links Grid. It is also possible to add a user defined curve in the Valve Curve Grid View. The curves can be viewed by right clicking the valve to be viewed in the Valve Curve Grid and selecting Properties from the menu.
The Valve Curve Page displays a graph relating the log of the loss coefficient of the valve to percentage opening and valve flow coefficient to percentage opening. The graph view can be changed to display a linear scale.
A loss coefficient / percentage opening grid is also displayed. The grid view can be changed to display flow coefficient values.
A second curve can be displayed on the graph view from any of the existing built in curves or user specified curves by using the "Other Valve Curve" drop down menu and checking the "Show Curve" box.
User defined curves can be defined by entering values into the loss coefficient/percent opening or flow coefficient/percentage opening grid. Alternatively, values from existing curves can be used as a basis for curve definition by loading an existing curve into the grid of the current valve to be defined.
The relationship between Flow Coefficient Kd and Local Loss Coefficient
![]() is given by the equation:
is given by the equation:
|
|
|

