A sample network was built up previously and this will be used to demonstrate the use of water quality modelling.
This stage assumes that you have started InfoWorks WS Pro and that the Model Group window is open, showing the WQ icon.
This stage of the lesson assumes that a treatment chemical is to be added to one of the boreholes (KBH_2) at a fixed rate of 10 mg/litre. The control data is adjusted for that node and a water quality simulation is run.
- Choose from the menu. In the list of objects click to the left of 'Tutorial', click 'WQ' and then .
- Open the 'Newtown WQ' network.
- Open the WQ Base Control to associate it with the network.
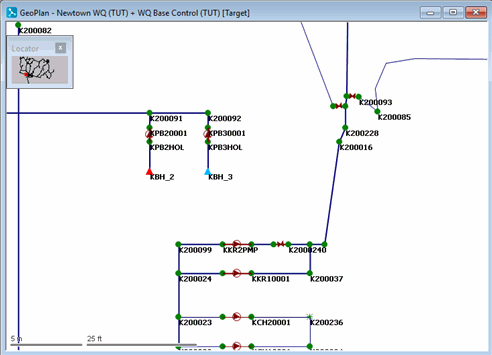
- Zoom
in on the area around borehole KBH_2.
- Add a treatment chemical at the borehole:
- Select the
 (Properties) tool
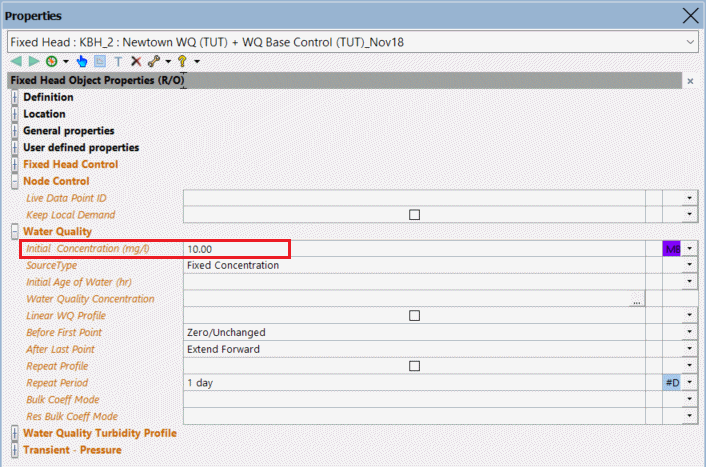
and click KBH_2 to display the borehole's properties.
 - In the Water Quality section, add an of 10 mg/l.
- This level of chemical will now be added to all water pumped from the borehole.
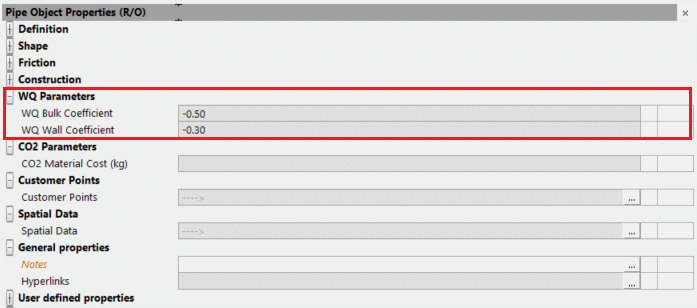
- Display the properties for a pipe. The properties sheet includes two water quality parameters, the default values for which have been derived from research.
- Commit the WQ Base Control data, commenting appropriately. Close the GeoPlan view.
- Create a run using the new data:
- Right-click the Newtown Control Simulations group and select .
- Enter a of 'WQ Run 1'.
- Drag the 'Newtown WQ' icon into the box, the 'WQ Base Control_1' control object into the box and the Profiles demand diagram icon into the box.
- Change the date and time to 1 October 1998 00:00 and the date and time to 2 October 1998 00:00.
- Set the to 5, the to 50 and the to 1 l/s.
- Specify the water quality parameters:
- Select from the drop-down list. The Water Quality Options dialog is displayed.
- Set the to KBH_2.
- Leave the as 0 and the as 0.
- Click .
- Run the simulation:
- Click .
- When the simulation is complete, close the Output window.
- Close the GeoPlan view.
The next stage investigates graphs of the simulation data and demonstrates the use of a water quality theme.


