The first stage added some water quality data to a borehole (KBH_2) and ran a simulation. This stage looks at ways in which the water quality parameters can be graphed and demonstrates the use of themes.
This stage assumes that you have started InfoWorks WS Pro and that the Model Group window is open, showing the WQ icon.
To display graphs and themes:
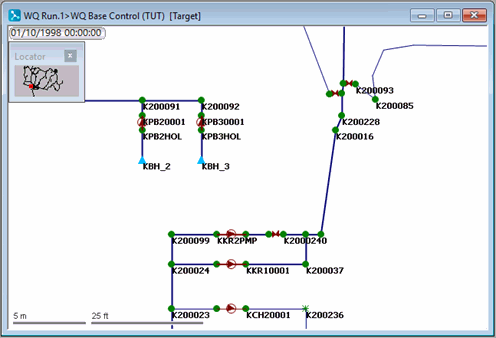
- Display the simulation in the GeoPlan view:
- Open the 'WQ Base Control_1' from the 'WQ Run1' Run Group.
- Zoom in on the borehole.
- Display the water quality graphs for a node:
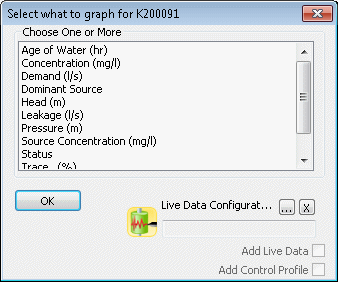
- Use the
 (Graph) button to select
a graph for K200091. There are now additional parameters to choose
from: Concentration, Trace, Age of Water, Dominant Source and Source Concentration.
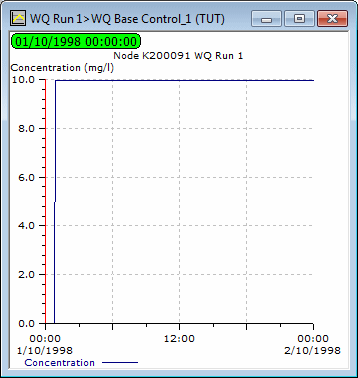
- Select the Concentration graph. This displays
the concentration of the chemical at the node over the period of the simulation.
For this node, which is very close to the borehole, the full concentration
arrives at the node almost immediately.
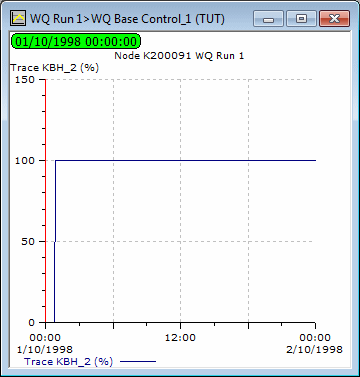
- Select the Trace graph. This displays the
proportion of water received from the trace node (KBH_2) at any time.
The graph shows that all water passing through the node is from the trace
node after about 50 minutes.
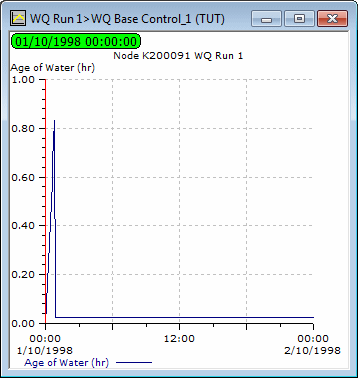
- Select the Age of Water graph. This displays
the age of the water at the selected node (i.e. the time taken to travel
to the node from the trace node). The peaks in the graph correspond to
the times when the pump for the borehole was switched on.
- Produce similar graphs for the reservoir CRES2:
- Right-click the GeoPlan and select Find Network, then zoom in on the reservoir.
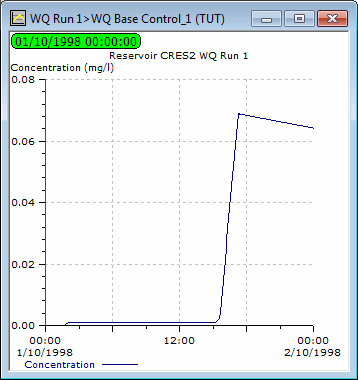
- Select the Concentration graph. This shows that it takes some hours for the initial concentration to reach the reservoir. The concentration increases until the pump is switched off, following which it decays until the pump is switched on again.
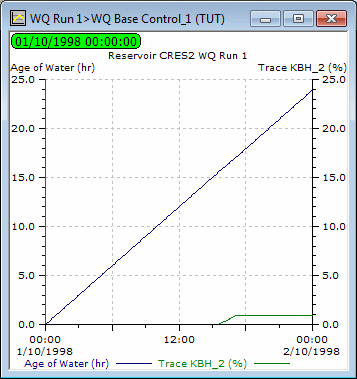
- Select the Trace and Age of Water together
on a single graph. This shows the proportion of water from the trace node
and the time taken to reach the reservoir.
- Investigate a node at the edge of the network:
- Identify node K200123.
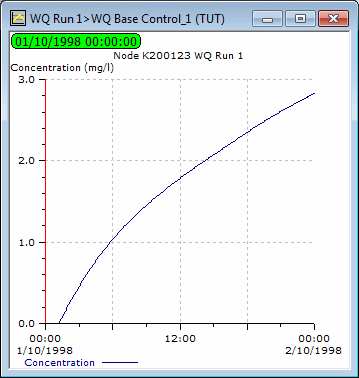
- Display the graph for Concentration. This
shows that the water from KBH_2 takes much longer to reach this node and
the concentration is much lower.
- Use a theme to demonstrate the effect over the network as a whole of adding the chemical:
- Display the whole network and turn off the Locator window.
- On the GeoPlan Properties And Themes dialog, open the layer theme editor for the Node object layer (by clicking in the Theme column).
- Create a new sub theme and name it Concentration.
- Choose the sim.CONC01 field to show the concentration throughout the network. This is available only if there are simulations.
- In the Ranged Themes area, increase the value count to 11.
- For the eleventh value, show the cross in the Fix column, then set the value to 1 and click AutoScale.
- Click on the layer theme editor and on the GeoPlan Properties And Themes dialog.
- Replay the simulation. The changing colour of the nodes illustrates the spread of the chemical through the network.
- Turn off the theme and close the GeoPlan view.
The next stage extends the use of water quality modelling to demonstrate the effect of a pollution incident on the network.

