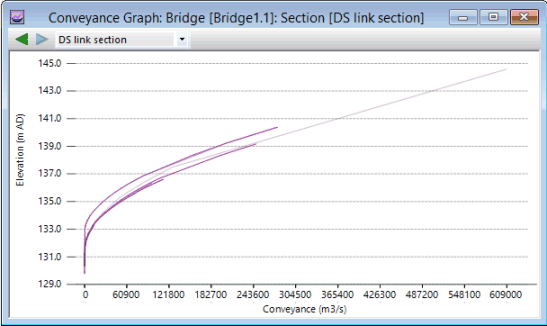
Conveyance Graph Window
The Conveyance Graph Window displays a graph of either a selected river reach or a bridge section, where conveyance is plotted against elevation. Using this window you can:
- view the shape of the conveyance curve for the selected section to check that it is a monotonically increasing function of depth/level
- compare the shape of the conveyance curve of the selected section against the conveyance curve of neighbouring sections
The Conveyance Graph Window is displayed when the Conveyance graph pick  button on the More GeoPlan Tools Toolbar is clicked and a river reach or bridge section is subsequently selected on the GeoPlan.
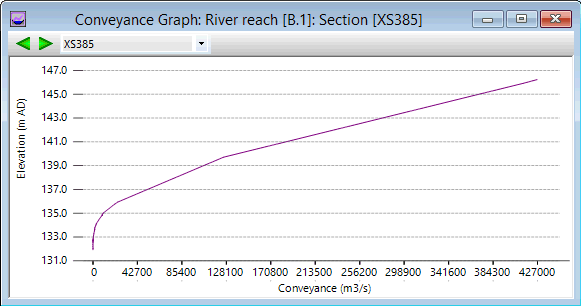
The window initially displays the conveyance curve for the selected section, and you can use the window options to display additional curves. Conveyance Graph Window options.
For river reach sections, up to 9 additional conveyance curves can be displayed for neighbouring sections, located up or downstream of the selected section.
For bridge sections, the conveyance curves can be displayed for the upstream link, upstream bridge, bridge deck (contraction), bridge deck (expansion), downstream bridge and downstream link sections. Note that the sections for the Bridge deck (contraction) and Bridge deck (expansion) sections are obtained by combining the bridge deck section with the upstream and downstream bridge sections respectively.
The conveyance curves for additional sections can be displayed in the Conveyance Graph Window using the  and
and  buttons or by selecting the applicable section(s) from the drop down menu.
In addition, you can right-click over the cross section to display a context menu with the following options. Please note that these commands can also be selected from the Section menu when a Conveyance Graph Window is the currently active view.
|
Move Downstream |
Selecting this option or pressing the Page down key shows the conveyance graph for the section downstream of currently displayed section. |
|
Move Upstream |
Selecting this option or pressing the PaGe UP key shows the conveyance graph for the section upstream of currently displayed section. |
|
Properties |
Clicking on this option displays the Conveyance Graph Properties dialog, where changes can be made to the way in which the section is displayed. |
The following icons on the toolbar allow you to move around the Conveyance Graph view:
|
Zoom In |
Click on the |
|
Zoom Out |
Click on the |
 button or press
  button, and then click on the Conveyance Graph
view to zoom out from the current view.
button, and then click on the Conveyance Graph
view to zoom out from the current view.Alternatively, the mouse scroll wheel can be used to zoom in and out on the Conveyance Graph Window.
