Graph Selection Dialog
The graph selection dialog is used to display results for more than one network object on the same graph.
To display the dialog:
- Open a simulation for replay.
- Select one or more network objects.
- Click on the Graph Selected Objects button
 on the Results Toolbar or
Selection operations | Graph results from the Selection
menu.
on the Results Toolbar or
Selection operations | Graph results from the Selection
menu.
The main parts of the dialog are contained in the Left and Right boxes. These define what will be displayed on the left and right axes of the graph.
See Results on Graph Views for more on graphing the data of more than one network object.
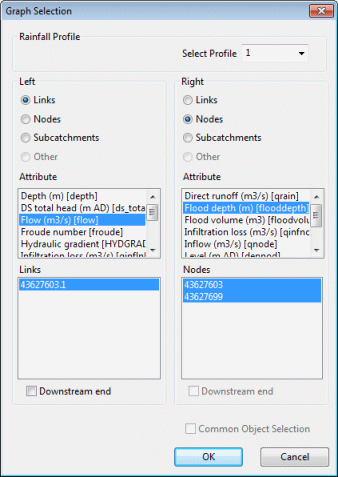
The following options are available on the dialog:
|
Rainfall Profile |
Displays a rainfall profile in addition to the ten traces. Select the profile number from the dropdown list. |
|
Left/Right |
These buttons are displayed if more than two network object types are included in the current selection. The radio buttons allow the choice of which type of object is to be graphed on the left and right axes. |
|
Attribute Lists |
The upper list in the Left and Right boxes lists parameters you can graph in accordance with the object type selected using the Left and Right buttons above. When the Other button is selected as the object type, only attributes common to all of the objects selected in the Object List will be displayed. |
|
Object List |
The lower list in the Left and Right boxes is the Object List. Before opening this dialog one or more network objects must be selected. These two lists display the selected objects of the type chosen using the the Left and Right object radio buttons. Within the two lists you can choose to adjust your selection by clicking on individual entries to deselect or reselect them. Parameters will only be graphed for objects selected (highlighted) in these lists. |
|
Downstream end check-box |
If you select one or more links you will be offered the chance to display data from the downstream end of the links. The default is to display data from the upstream end. |
|
Common Object Selection check box |
This check box is active when the object type to be graphed is the same on both axes. When the box is checked, selections in the right hand list are synchronised with those in the left list. When objects are selected or deselected in either list the change takes effect in both lists. To split the lists, ensure that the box is unchecked. |
