RTK Method
InfoWorks ICM uses the RTK method to generate a hydrograph used to determine RDII from a subcatchment in InfoWorks networks or a node in SWMM networks.
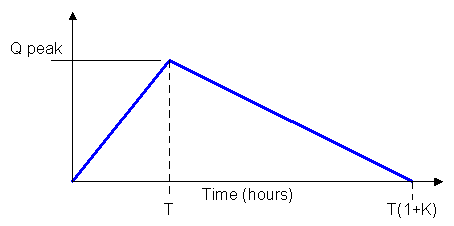
Each set of RTK parameters defines a triangular graph against time, where:
- R is the area under the graph representing the proportion of rainfall falling on the subcatchment (InfoWorks networks) or node (SWMM networks) that enters the sewer system
- T is the time from the onset of rainfall to the peak of the triangle
- K is the ratio of 'time to recession' to the ' time to peak' of the hydrograph

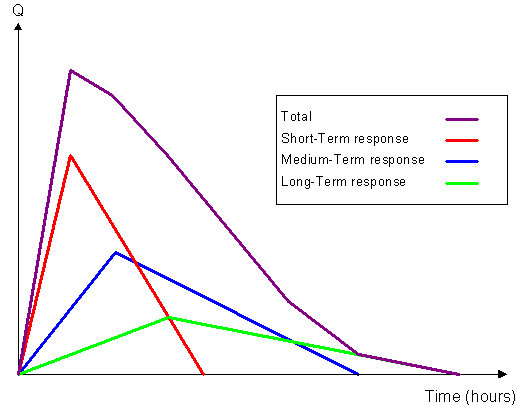
Three sets of RTK parameters can be defined, representing short-term, medium-term and long-term rainfall response. The three triangular graphs are combined to define the Unit Hydrograph.

RTK Hydrograph and Component Hydrographs
In addition, short-term, medium-term and long-term responses for the following parameters can also be defined:
- Maximum initial abstraction rainfall depth (the maximum depth of initial abstraction capacity available for the subcatchment in InfoWorks networks or node in SWMM networks)
- Abstraction recovery rate (the rate at which capacity becomes available again during periods of no rainfall)
- Initial rainfall depth (the amount of that capacity already used up at the start of the simulation)
These parameters can be used to determine how much rainfall is lost to interception and depression storage before any excess rainfall is generated and transformed into RDII flow by the hydrograph.
