Damage Function Graph Dialog
This dialog is displayed when the  (Ellipsis) button is selected on a 'curve' field in the Damage Function Editor.
Any damage data that has been either:
- imported from an InfoWorks csv file to a Damage Receptor
- imported from the csv files generated from the Excel spreadsheets supplied in the Multi-Coloured Handbook and CD 2010 to a Damage Receptor
- previously specified in this dialog
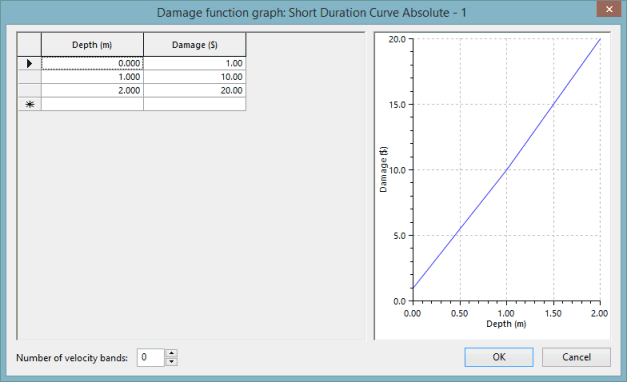
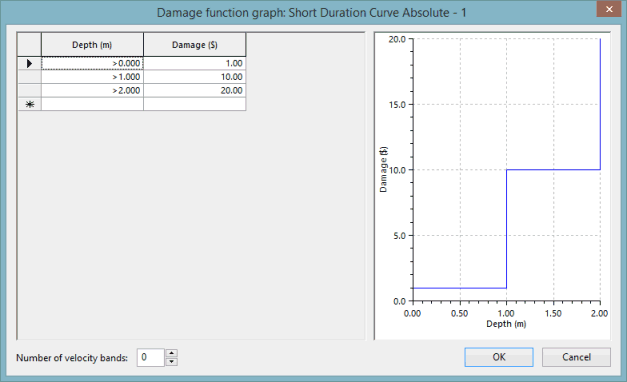
will be displayed in the grid section and the appropriate curve shown in the graph section.
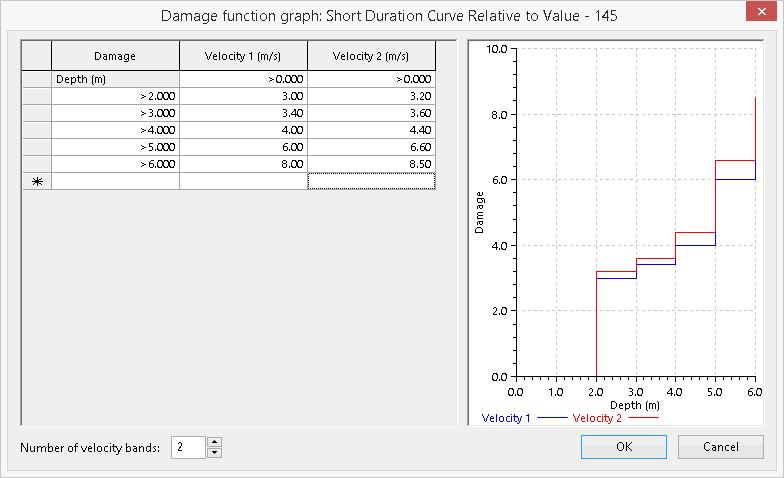
The type of graph displayed (continuous line or stepped) is determined by the setting in the Interpolation field in the Damage Function Editor grid window.
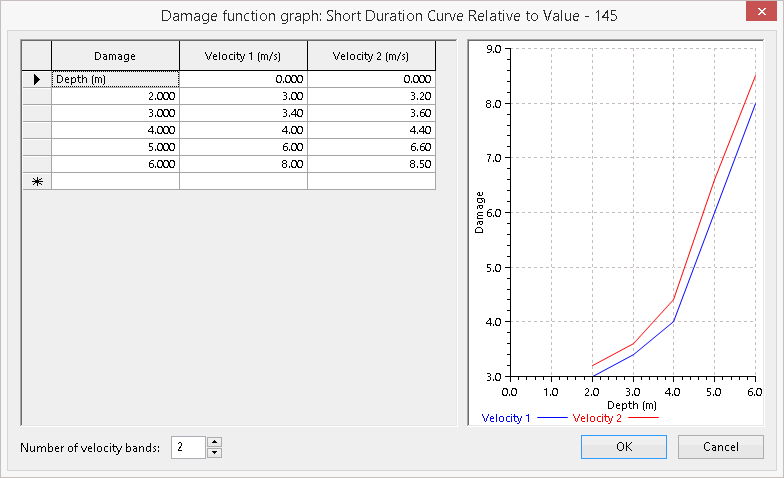
If data for velocity-dependent damage curves has been imported from an InfoWorks csv file or previously specified in this dialog, then this will also be displayed.
You can use the Number of velocity bands box to specify up to 10 velocity-dependent damage curves. If the number of velocity bands is set to zero, then damage will not depend on velocity. If there is one or more velocity band, then damage for velocities below the lowest specified velocity threshold will be either (a) zero, for stepped curves or (b) linearly interpolated between zero and the lowest specified threshold, for linearly interpolated curves.
When you select the number of velocity bands to be displayed, the number of damage columns on the grid increases or decreases accordingly.
The corresponding curves for each of the velocity columns will be displayed in the graph as the data is entered into the grid.


