Graph View
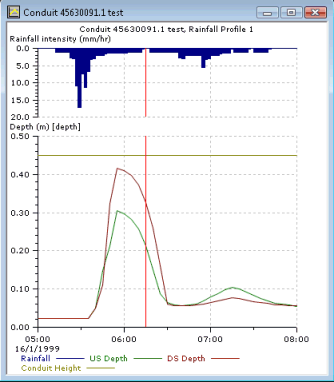
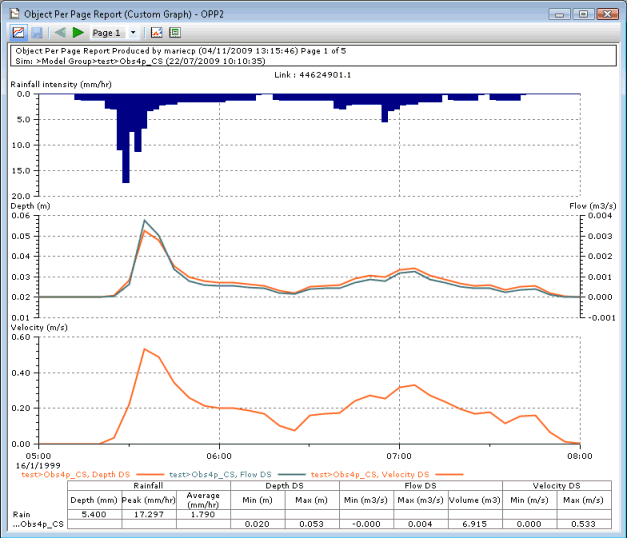
This view is used in many places to display graphical information. The view may be a simple graph for a single parameter or multi graph reports comparing observed against model data.

Graph View Toolbar
|
|
Go to the previous page of the graph view. |
|
|
Go to the next page of the graph view. |
|
|
Go to the desired page. |
|
|
Launches the Generate Scatter Graph dialog, which allows you to graph the data in a scatter graph. This type of graph can be used to look for a correlation between the two sets of data. |
|
|
Export Traces to CSV. Click this to open a standard Save As dialog where you can specify a location and filename. When the traces are saved to a file in CSV format, it allows graph data to be viewed in other applications. |

There is no toolbar for scatter graphs and simple graph. Also, the toolbar for Custom Graphs is more complex than the one described above. See Custom Graph View for more details.
Context menu
The graph context menu provides options that are dependent on the graph type.
This option is not available for Custom Graphs or Graph Reports.
Select this option to export traces from the Graph View to CSV format allowing graph data to be viewed in other applications. See Exporting Traces to CSV for further information.
This option is not available for Custom Graphs or Graph Reports.
Select this option to generate a scatter graph from the existing graph. A scatter graph is a statistical diagram drawn to compare two sets of data. It can be used to look for a correlation between the two sets of data. See Generate Scatter Graph dialog for further information.
This option is enabled for graphs of network data with a time X-axis and a current simulation open.
Select this option to display auto-labels showing trace values at the current time of simulation when viewing Results on Graph Views.
Right click on the Graph View and select Auto-label traces from the context menu to display the labels.
For most graphs, many changes are made on the Graph Properties dialog, which can be launched by right clicking on the Graph View and choosing Graph Properties from the popup menu. The changes you can make on this dialog are:
- Overall graph title and appearance, including display of grid lines.
- Changes to the graph axes. Titles, font, size and colour can all be changed. The minimum and maximum scales can be set by you or calculated automatically. All changes can be made independently for each axis.
- Change the way each trace is drawn, including colour, line thickness and optional symbol. Different styles can be used for screen and print.
This option is available for Custom Graphs or Graph Reports.
To add you own comment to the top of the Title Block (see below), right-click on the graph and select Set Comment. See User Comment dialog for more details.
This option is available for Custom Graphs or Graph Reports.
The header text at the top of each graph page displays information about the data you are graphing.
To show or hide the header, right click anywhere on the graph view and choose Include title block or Exclude title block from the popup menu.
This option is available for Custom Graphs or Graph Reports.
InfoWorks ICM displays a table at the bottom of the page giving statistics, including minimum and maximum values.
To show or hide the statistics table, right click anywhere in the graph view and choose Include statistics table or Exclude statistics table from the popup menu.
Other graph properties
Other aspects of the graph are described below.
Some more complex graph reports may contain more than one page. If the report contains more than one page, as seen in the example of a more complex report above, then you can scroll through the pages using the pgup and pgdn keys.

This functionality is not available for Custom Graphs as the different pages can be accessed via the  and
and  buttons of the toolbar.
To zoom in on part of the graph, click the  toolbar button,
or hold down the Shift key and drag the mouse
across the area you wish to magnify. This creates a rubber band box that
extends horizontally across the zoom area. The mouse must start within
the boundary of the graph itself.
To zoom out, click on the  toolbar button and then click
within the graph area to zoom out to the previous zoom extent.
To restore the original time axis, double click within the graph area with the left mouse button.
Hover over the trace or data point with the cursor to display a tooltip showing the graph value.
Values at locations on traces between data points will be interpolated. An interpolated value is denoted in the tooltip by an asterisk after the trace value.
On graphs produced by the Pick
Graph  tool or the Graph
Selected Object
  tool only, the red time line shows the current
time of the simulation, mirroring the current time of the simulation on
the Geoplan. To
jump to a different simulation time, you can
drag and drop the red line to the desired simulation time directly on
the graph. The simulation date & time will be updated accordingly
on the Geoplan.
Right click on the graph view and select Auto-label traces from the context menu to display a label showing the value of the trace at the current time of the simulation.
On graphs produced by the Pick
Graph  tool or the Graph
Selected Object
  tool only, the blue time line shows the run origin time of the simulation.
The graph can be copied to the clipboard or saved to a file in Windows MetaFile (WMF) format. It can also be printed.
- To copy the graph as a Windows MetaFile, choose Copy/save view / Clipboard (WMF) or Copy/save view / File (WMF) from the Edit menu.
- To print the graph, choose Print from the File menu. You can also:
- Preview the print by choosing Print preview from the File menu.
- Setup the margins for the page by choosing Page setup from the File menu. This displays the Graph Page Setup dialog.


