Graph Reports
Results can be graphed by using the Results | Graph reports menu option. The available graph reports are described below.
Customised graphs can also be produced by using the Results | Custom graphs menu options. See Custom Graphs for further details.
See Results on Graph Views for information on producing a graph of time varying data for a single network object or for a selection of objects.
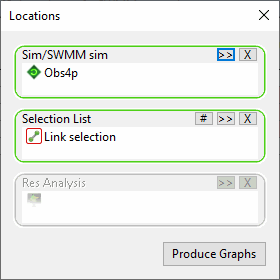
The Locations Report allows graphing of results for different locations from the same simulation against each other. For example, in order to view the flow lag down a branch, results for each pipe of the branch can be plotted on the same set of axis.
To create a location report:
- Select Graph reports | Location report from the Results menu. This displays the Locations Dialog.
- In the Locations Dialog define the simulation for which results are to be graphed and either a Selection List or Results Analysis to specify the objects (locations) to be graphed:
- Sim/SWMM sim - drag and drop the desired simulation from the Explorer Window.
- Selection List - drag and drop
a saved Selection List or click the Current button (
 ) to include all objects
currently selected in the GeoPlan Window.
 - Results Analysis InfoWorks networks only -
drag and drop a saved Results
Analysis item or click the Current button
(
 ) to include all Results
Analysis Points currently displayed on the GeoPlan Window.
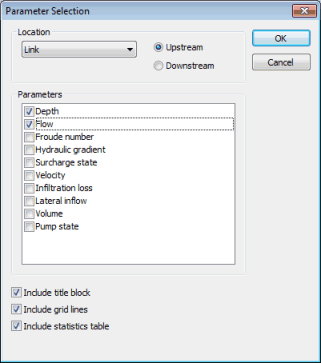
 - Click the Produce Graphs button. This displays the Parameter Selection Dialog.
- From the Parameter Selection dialog, select the type of location to view and the parameters to be graphed (up to three parameters may be selected at a time). For multiple locations, when plotting Link results, select whether to display results from the Upstream or Downstream end. Select other items to be included on the graph view from the bottom of the dialog e.g. title block, grid lines etc.
- Click on OK to view the graphs.
 Tip
Tip Note that the Locations dialog will remain on the screen to allow you to create more sets of graphs if required.
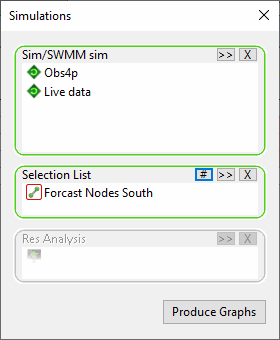
This simulation report allows graphing of results from one or more simulations. The report includes one page for each selected location.
To create a single or a multiple simulation report:
- Select Graph reports | Simulation report from the Results menu. This displays the Simulations Dialog.
- In the Simulations dialog define one or more simulations for which results are to be graphed and either a Selection List or, for InfoWorks networks only, Results Analysis to specify the objects (locations) to be graphed:
- Sim/SWMM sim - drag and drop one or several simulations of the same type from the Explorer Window.
- Selection List - drag and drop
a saved Selection List or click the Current button (
 ) to include all objects
currently selected in the GeoPlan Window.
 - Results Analysis InfoWorks networks only -
drag and drop a saved Results
Analysis item or click the Current button
(
 ) to include all Results
Analysis Points currently displayed on the GeoPlan Window.
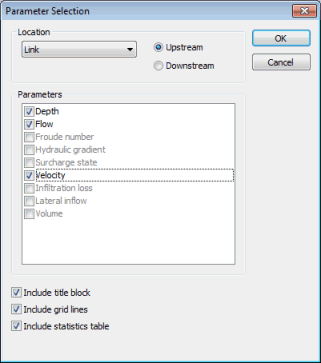
 - Click the Produce Graphs button. This displays the Parameter Selection Dialog.
- From the Parameter Selection dialog, select the type of location to view and the parameters to be graphed (up to three parameters may be selected at a time). For multiple simulations, when plotting Link results, select whether to display results from the Upstream or Downstream end. Select other items to be included on the graph view from the bottom of the dialog e.g. title block, grid lines etc.
- Click on OK to view the graphs.
 Tip
Tip If only one simulation is specified in the Sim/SWMM sim box of the Simulations dialog, additional data - rainfall, ground level and flood level for nodes and rainfall and soffit level for links - can be graphed and specified on the Parameter Selection dialog.
 Tip
Tip Note that the Simulations dialog will remain on the screen to allow creation of further sets of graphs if required.
The simulation summary report allows you to graph the summary results (e.g. Total Outflow or Rainfall Intensity) from several simulations of the same type against each other.
To create a Simulation Summary Report:
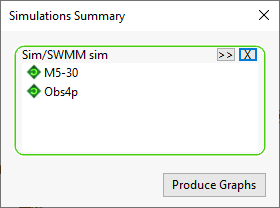
- Select Graph reports | Simulation summary report from the Results menu. The Simulation Summary dialog appears.
- In the InfoWorks ICM Explorer Window, drag the simulations in which you are interested into the Simulations Summary dialog. You can load in up to ten different simulations but they must be of the same type. If you drag in a run, instead of a simulation, all the simulations belonging to that run will be added.
- You can clear your choice of simulations at any time by clicking on the
 button.
 - When you have chosen the simulations, click on the Produce Graphs button.
- Click Produce Graphs to view the graphs.
 Tip
Tip Note that the Simulations Summary dialog will remain on the screen to allow you to create more sets of graphs if required.
