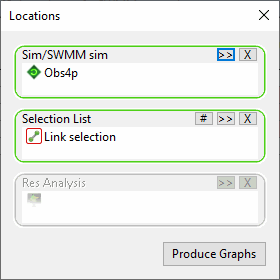
Locations Dialog
This dialog is used when producing a Location Report (for this report, a single simulation and either a single Selection List or, for InfoWorks networks only, a Results Analysis object must be selected).
The dialog is displayed when the Graph reports | Location report option is selected from the Results menu.
The dialog consists of the following Selection Boxes with buttons:
- Sim/SWMM sim - select the simulation for which results are to be graphed. If the current GeoPlan View contains simulation results, this box will automatically be populated with the current simulation.
- Selection List - identify objects to be graphed by selecting a saved Selection List or click the Current button to include all objects selected in the current GeoPlan View. (This box will be disabled if a Results Analysis has already been selected.)
- Res Analysis - InfoWorks networks only - identify 2D Results Analysis Objects to be graphed by selecting a saved Results Analysis or click the Current button to include all Results Analysis Objects present in the current GeoPlan View. (This box will be disabled if a Selection List has already been selected.)
Buttons:
-
 Current button - click this button to include all objects of the correct type selected in the current GeoPlan View in the corresponding selection box.
 -
 Browse button - click this button to browse the Common Tree Selection dialog to search for an item to place in the selection box.
 -
 Remove button - click this button to remove an item from the selection box it is currently in.
The Produce Graphs button will be enabled when both a simulation has been selected together with either a Selection List or a Results Analysis object.
Click the Produce Graphs button to select the object parameters to be graphed on the Parameter Selection Dialog.

