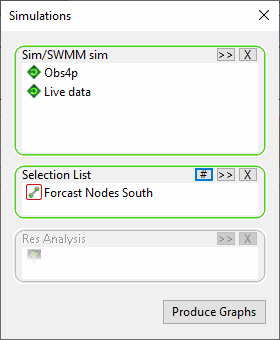
Simulations Dialog
The Simulation report allows graphing of the results of several simulations against each other.
The Simulations dialog allows selection of one or more simulations to be used and the parts of the network to be graphed.
The dialog is displayed when Graph reports | Simulation report is selected from the Results menu.
The dialog consists of the following Selection Boxes with buttons:
- Sim/SWMM sim - select the simulations for which results are to be graphed. Drag in a run, instead of a simulation, to add all the simulations belonging to that run.
- Selection List - identify objects to be graphed by selecting a saved Selection List or click the Current button to include all objects selected in the current GeoPlan View. (This box will be disabled if a Results Analysis has already been selected).
- Res Analysis - InfoWorks networks only - identify 2D Results Analysis Objects to be graphed by selecting a saved Results Analysis or click the Current button to include all Results Analysis Objects present in the current GeoPlan View. (This box will be disabled if a Selection List has already been selected.)
Buttons:
-
 Current button - click this button to include all objects of the correct type selected in the current GeoPlan View in the corresponding selection box.
 -
 Browse button - click this button to browse the Common Tree Selection dialog to search for an item to place in the selection box.
 -
 Remove button - click this button to remove an item from the selection box it is currently in.
The Produce Graphs button will be enabled when both a simulation(s) has been selected together with either a Selection List or a Results Analysis object.
Click the Produce Graphs button to select the object parameters to be graphed on the Parameter Selection Dialog.

