Transients advisor
InfoWorks WS Pro includes a simulation option allowing production of additional results, which can be used as an indicator of potential problem areas due to transient pressures.
To turn the option on, turn on the Advise on Hydraulic Transients option on the Simulation Options dialog.
This topic discusses the mechanics of pressure wave propagation and the calculations carried out by InfoWorks WS Pro.

Transients analysis is a highly complex subject requiring specialist knowledge and software.

The transient advisor results produced by InfoWorks WS Pro provide a qualitative estimate of potential problem areas due to transient pressures that you may wish to investigate further. To carry out a detailed analysis of transients, a transient system simulation should be run.
Hydraulic transients
Hydraulic transients (also known as water hammer or surge) are pressure fluctuations caused by a change in fluid velocity.
Causes of transients in a water supply network include:
- Starting / stopping of pumps
- Opening / closing of valves
- Outage of pumps / pipes due to a power failure / burst
Transients may cause problems in the water supply network in several ways :
- Pipe bursts caused by pressures induced exceeding pressure rating of pipe
- Hydraulic oscillations resulting in weakening of pipe
- Potential water quality problems caused by low pressures causing a temporary vacuum
Example
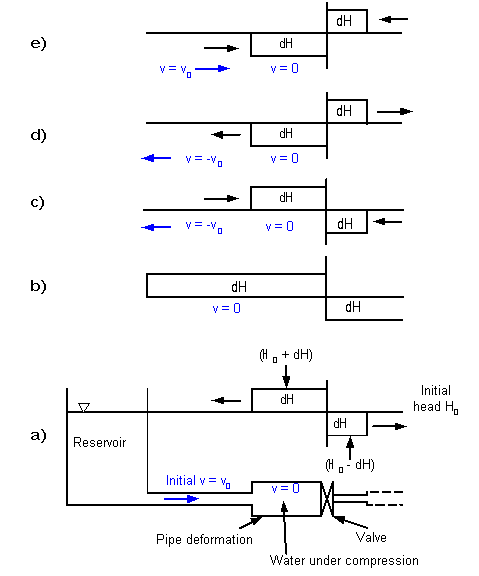
Consider the pipe upstream of a valve that has been instantaneously closed:

- As the valve is closed, the water adjacent to the valve is brought to rest with consequent compression of water upstream of the valve and expansion of the pipe cross section upstream of the valve. The increase in pressure at the valve causes the generation of a pressure wave with positive excess pressure head (DH) which is propagated upstream.
- The pressure wave reaches the reservoir.
- Water is forced backwards into the reservoir. Velocity in the pipe reverses and pressure drops back to static (reservoir pressure) again. The pressure wave is reversed and propagated back towards the closed valve.
- As the pressure wave reaches the closed valve, a low pressure region forms at the valve, destroying flow and generating a pressure reducing wave which is propagated towards the reservoir.
- Pressure reducing wave reaches the reservoir. Water flows from reservoir into pipe, velocity in pipe is reversed and a pressure generating wave is propagated towards the closed valve.
The cycle is repeated with the pressure oscillations being damped within a short period of time by friction.
Transients advice in InfoWorks WS Pro
Additional transient pressure amplitude and maximum transient pressure results may be produced when running a simulation, which can be used as an indicator of potential problem areas due to transient pressures.
To turn the transient advice option on, set the Advise on Hydraulic Transients option on the Simulation Options dialog.
The transient pressure result displays the amplitude of the pressure wave and is calculated using Joukowski's law:
|
|
Transient pressure DH at instantaneous valve closure in a rigid pipe:
where: g = acceleration due to gravity Dv = change in fluid velocity c = wave celerity |
Transient pressure amplitude is calculated for each timestep (t) where:
- Change in fluid velocity (DV) =
- velocity at previous timestep - velocity at current timestep
Therefore the transient pressure at the first simulation timestep will be zero.
- Wave celerity (c) =
- wave celerity value defined in links grid view
- default value of 1400 m/s if value not specified in grid view
Setting wave celerity
Wave celerity is dependant on the elasticity of the fluid and of the pipe itself and on pipe external restraints.
Wave celerity can be automatically set based on pipe materials from wave celerity values set in the Pipe Materials dialog, (see Setting wave celerity for more details). However, this functionality allows only one wave celerity value per pipe material to be set from the Pipe Materials dialog.
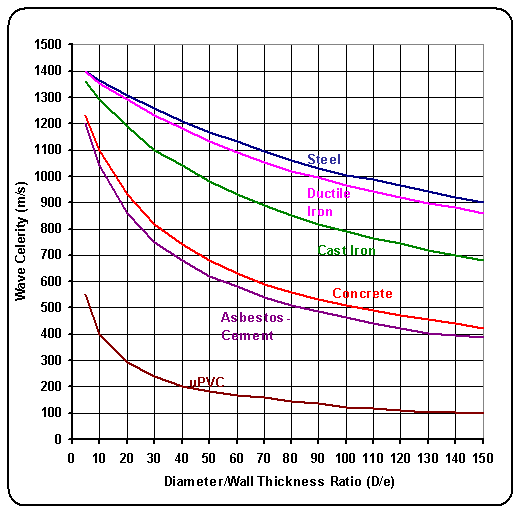
Wave celerity values can also be entered manually in the links grid view. Wave celerity values can be determined from the graph and table below (from Fluid Transients in Pipeline Systems, Thorley ARD, 1991), which contain curves of wave celerity against diameter/wall thickness ratio for several pipe materials.

Wave Celerity Diagram
| Diameter / Wall Thickness ( D/e) | Steel | Ductile Iron | Cast Iron | Concrete | Asbestos-Cement | uPVC |
|---|---|---|---|---|---|---|
|
5 |
1400 |
1400 |
1360 |
1230 |
1200 |
550 |
|
10 |
1365 |
1355 |
1290 |
1100 |
1040 |
400 |
|
20 |
1310 |
1290 |
1190 |
930 |
860 |
290 |
|
30 |
1260 |
1230 |
1100 |
820 |
750 |
240 |
|
40 |
1210 |
1180 |
1040 |
740 |
680 |
200 |
|
50 |
1170 |
1130 |
980 |
680 |
620 |
180 |
|
60 |
1130 |
1090 |
930 |
630 |
580 |
168 |
|
70 |
1095 |
1055 |
890 |
591 |
540 |
157 |
|
80 |
1060 |
1020 |
848 |
560 |
510 |
145 |
|
90 |
1030 |
995 |
820 |
530 |
485 |
135 |
|
100 |
1005 |
965 |
790 |
510 |
465 |
125 |
|
110 |
985 |
940 |
765 |
490 |
440 |
118 |
|
120 |
965 |
920 |
745 |
475 |
421 |
110 |
|
130 |
940 |
895 |
720 |
455 |
405 |
105 |
|
140 |
920 |
880 |
700 |
440 |
395 |
103 |
|
150 |
900 |
860 |
680 |
425 |
385 |
100 |
Table of Wave Celerity Curves (Thorley ARD 1991)
Analysing results

Transient advisor results produced by InfoWorks WS Pro are suitable for use as a qualitative estimate only. The results can be analysed to determine links potentially at risk due to large transient pressures, which should be investigated further. Full transients analysis can be carried out using an InfoWorks TS (transient system) simulation.
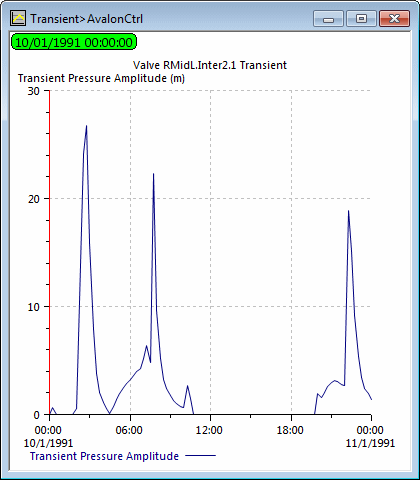
The transient advisor results can be displayed as for other results: in a grid report or as a graph of the time varying result for a single network object.
Transient pressure amplitude will be graphed as smooth continuous lines
joining transient pressure values. ![]() Show image
Show image
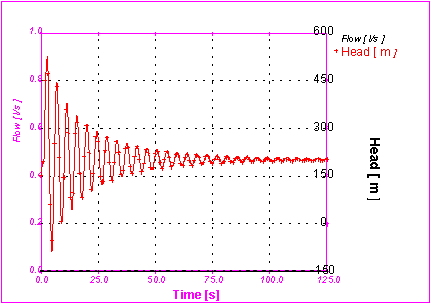
In reality transient pressure changes occur over a very short time period
(seconds). ![]() Show image
Show image
The smooth graph traces produced by InfoWorks WS Pro represent an approximate bounding envelope for the real, spiky transients.


