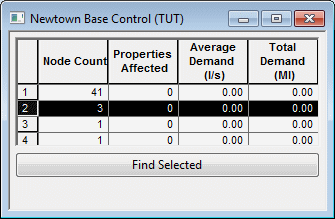
Grid Report (Service Level - Clusters) view
This view displays a report of clusters of failures to meet a required service level.
The view is generated as part of a Service Level Report, when the option Show clusters of Service Level Failures is selected on the Grid Report (Service Level) dialog.
A cluster is defined as a collection of failing nodes (or nodes with failing customer points) that are either directly connected, or are connected via non demand nodes.
| Item | Description | ||||||||
|---|---|---|---|---|---|---|---|---|---|
| Service level report columns for a report on nodes |
There is a row in the grid for each detected cluster.
|
||||||||
| Service level report columns for a report on customer points |
There is a row in the grid for each detected cluster.
|
||||||||
| Find Selected (button) | When a row in the grid is selected, clicking this selects the corresponding nodes or customer points in the Service Level Report grid and the GeoPlan window. |

