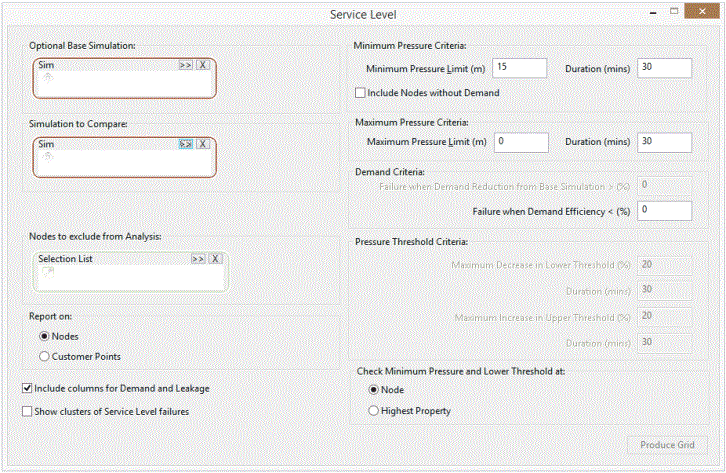
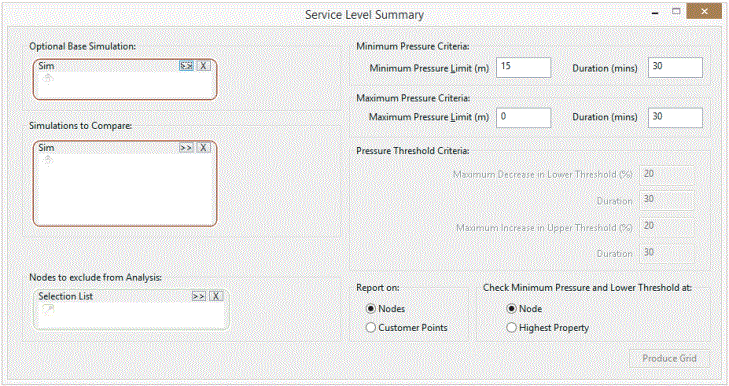
Grid Report (Service Level / Service Level Summary) dialog
The Service
Level dialog is used to produce a grid report of failures to meet defined
service levels during a single simulation. The dialog is displayed when
Results | Grid reports | Service level is
selected, or when a
critical link analysis simulation
is dragged into the workspace. ![]() Show image
Show image
The Service
Level Summary dialog is used to produce a grid report of counts of failures
to meet defined service levels for a selection of simulations. The dialog is displayed when Results | Grid reports | Service level summary is selected, or when the base simulation of a critical
link analysis run is dragged into the workspace. ![]() Show image
Show image
See Producing service level reports for more details.
| Item | Description | ||||
|---|---|---|---|---|---|
|
Optional Base Simulation |
Base simulation/s against which simulation to be reported on will be compared. If a base simulation is selected, only nodes or customer points that failed level of service criteria in the base simulation but not in the simulation to compare will be reported in the grid. Nodes or customer points that failed level of service criteria in both the base simulation and the simulation to be compared will not be reported. |
||||
|
Simulation / Simulations to Compare |
Simulation/s for which the grid report is to be produced. If a simulation is open, this field will automatically be populated with the current simulation. For summary reports, multiple simulations can be added. |
||||
|
Nodes to exclude from Analysis |
A selection list of nodes that will not be tested for failures against the demand criteria (if applicable) or pressure threshold criteria. |
||||
|
Minimum Pressure Criteria |
The target minimum pressure and allowable duration. If the pressure falls below this target for a period longer than the Duration (where duration is cumulative over the length of the simulation), a failure is reported. The default values of the Minimum Pressure Limit and Duration fields are those set in the Service Levels page of the Options dialog. If a critical link analysis or shutdown simulation is open, these values will be populated with the minimum pressure criteria used for that simulation. Minimum pressure criteria checks will not be carried out if a zero is entered in the Duration field. |
||||
|
Include Nodes without Demand |
Not applicable to summary reports. Check this box to include non-demand nodes in the Service Level Grid view. |
||||
|
Maximum Pressure Criteria |
The maximum allowable pressure and duration. If the pressure rises above this limit for a period longer than the Duration (where duration is cumulative over the length of the simulation), a failure is reported. The default values of the Maximum Pressure Limit and Duration fields are those set in the Service Levels page of the Options dialog. If a critical link analysis simulation is selected, Maximum Pressure Limit will be populated with the maximum pressure criteria used for that simulation. Maximum pressure criteria checks will not be carried out if a zero is entered in the Maximum Pressure Limit or Duration fields. |
||||
|
Demand Criteria |
Not applicable to summary reports. The Failure when Demand Reduction compared to Base Simulation > (%) field is the allowable percentage reduction in demand when comparing against a base simulation (due to pressure related demand). If demand reduction falls below this target, a failure is reported. (The default value for this field is set in the Service Levels page of the Options dialog.) The Failure when Demand Efficiency < (%) field is used to define the allowable ratio of actual to nominal demand (averaged over the simulation). If a critical link analysis simulation is selected, Failure when Demand Efficiency < (%) will be populated with the average demand efficiency criteria used for that simulation. If a zero is entered in the field, the demand criteria check will not be carried out. |
||||
|
Pressure Threshold Criteria |
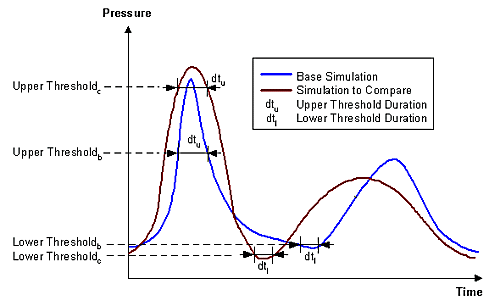
The allowable percentage difference between lower and upper pressure thresholds of the Simulation to Compare and the Base Simulation. If the percentage difference exceeds these criteria, a failure is reported. The default values of the Pressure Threshold Criteria fields are those set in the Service Levels page of the Options dialog. If a shutdown simulation is selected, the Pressure Threshold Criteria fields will be populated with the pressure threshold criteria used for that simulation.
Pressure threshold checks will not be carried out if a zero is entered as the threshold value. |
||||
| Report on |
Options to report on either nodes or customer points. |
||||
|
Check Minimum Pressure and Lower Threshold at |
Available only if Report on: Nodes has been selected. If you are creating a node report, and have set the highest property for each node, you can use this additional information and create service level reports either for the nodes or for the highest property served by each node. |
||||
|
Include columns for Demand and Leakage |
Not applicable to summary reports. Check this box to include Average Demand and Average Leakage values in the Service Level Grid view. |
||||
|
Show clusters of Service Level failures |
Not applicable to summary reports. Check this box to display a Clusters grid containing details of clusters of node or customer point failures. |
||||
| Produce Grid (button) |
|


