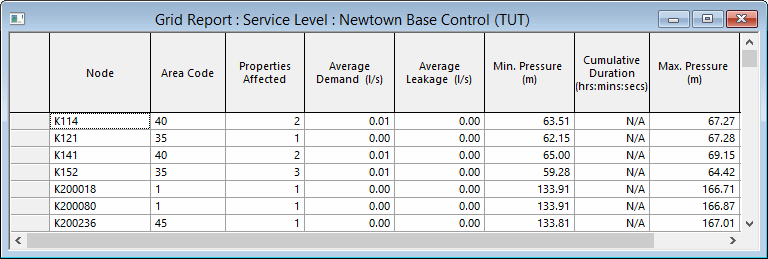
| Column |
Description |
Report on Node |
Report on Customer Point |
| Node |
Highest Property |
|
Node
|
ID of node where a Level of Service failure has occurred
|
YES
|
YES
|
YES
|
| Name |
Name of node where a Level of Service failure has occurred
|
YES
|
YES
|
YES
|
|
Area Code
|
The Area Code to which that node belongs
|
YES
|
YES
|
YES
|
|
Customer Point
|
The name of the Customer Point.
The Customer Point cell will be highlighted blue if the customer is
a Key Customer.
This field is displayed only if the Report on: Customer
Points option is selected on the Grid
Report (Service Level) dialog
|
YES
|
YES
|
YES
|
|
Using Elevation At
|
This field is displayed only if the Report on: Customer
Points option is selected on the Grid
Report (Service Level) dialog.
The field shows which elevation was used:
|
NO
|
NO
|
YES
|
|
Properties Affected
|
The number of properties supplied from the node which are affected by
the failure
|
YES
|
YES
|
NO
|
|
Average Demand
|
The average demand at the node during the simulation.
This field is only displayed if the Include columns
for Demand and Leakage option is checked on the Grid
Report (Service Level) dialog.
|
YES
|
YES
|
NO
|
|
Event Demand Change (%)
|
Percentage reduction in demand when comparing against a base simulation.
|
YES
|
YES
|
YES
|
|
Demand Efficiency (%)
|
Ratio of Actual to Nominal Demand (averaged over the simulation).
This field is displayed only when comparing simulation results to a
base simulation.
|
YES
|
YES
|
YES
|
|
Average Leakage
|
The average leakage at the node during the simulation
This field is displayed only if the Include columns
for Demand and Leakage option is checked on the Grid
Report (Service Level) dialog.
|
YES
|
YES
|
NO
|
|
Min Pressure
|
The minimum pressure reached during the simulation if pressure dropped
below the Minimum Pressure Limit for the specified Duration
N/A if pressure does not fall below Minimum Pressure Limit.
|
YES
|
YES
|
YES
|
|
Min Cumulative Duration
|
The total duration during the simulation when pressure dropped below
the threshold
|
YES
|
YES
|
YES
|
|
Tested At
|
This field is displayed only if the Highest Property
option is chosen on the Grid
Report (Service Level) dialog.
Elevation at which minimum pressure was tested. The field value may
be:
- Node: If the node does not have a highest property
- Highest Property
- N/A: If the node/highest property has not failed
the minimum pressure threshold
|
NO
|
YES
|
NO
|
|
Max Pressure
|
The maximum pressure reached during the simulation if the Maximum Pressure
Limit was exceeded for the specified Duration.
N/A if pressure does not exceed Maximum Pressure Limit.
|
YES
|
YES
|
YES
|
|
Max Cumulative Duration
|
The total duration during the simulation when pressure exceeded the
threshold.
|
YES
|
YES
|
YES
|
|
Base Lower Threshold
|
Calculated from the base simulation.
The lowest pressure experienced at the node or customer point for at
least the specified duration.
This field is displayed only when comparing simulation results to a
base simulation.
|
YES
|
YES
|
YES
|
|
Lower Threshold
|
Calculated from the simulation to be compared.
The lowest pressure experienced at the node or customer point for at
least the specified duration.
This field is displayed only when comparing simulation results to a
base simulation.
|
YES
|
YES
|
YES
|
|
Lower Threshold Change (%)
|
The percentage difference between the Lower Threshold and the Base Lower
Threshold.
This field is displayed only when comparing simulation results to a
base simulation.
|
YES
|
YES
|
YES
|
| Lower Threshold Time Of Onset |
Simulation time at which the Lower Threshold value was reached.
|
YES |
YES |
YES |
|
Base Upper Threshold
|
Calculated from the base simulation.
The highest pressure experienced at the node or customer point for at
least the specified duration.
This field is displayed only when comparing simulation results to a
base simulation.
|
YES
|
YES
|
YES
|
|
Upper Threshold
|
Calculated from the simulation to be compared.
The highest pressure experienced at the node or customer point for at
least the specified duration.
This field is displayed only when comparing simulation results to a
base simulation.
|
YES
|
YES
|
YES
|
|
Upper Threshold Change (%)
|
The percentage difference between the Upper Threshold and the Base Upper
Threshold.
This field is displayed only when comparing simulation results to a
base simulation
|
YES
|
YES
|
YES
|
| Upper Threshold Time Of Onset |
Simulation time at which the Upper Threshold value was reached. |
YES |
YES |
YES |

