Viewing GMR results: Grid Report and Geoplan
The summary table from the Analysis tab of the Generalised Multi Run (GMR) Configuration dialog can be displayed as a grid or as a theme in the GeoPlan.
The summary table is a data cube. The decision is how it should be aggregated for display.
To view GMR results:
-
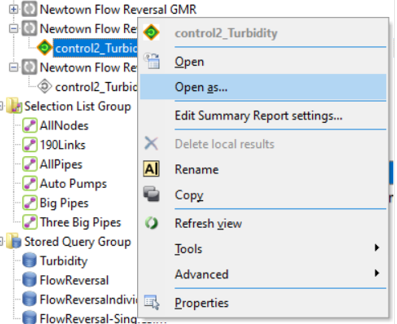
From the context menu, select Open as.
-
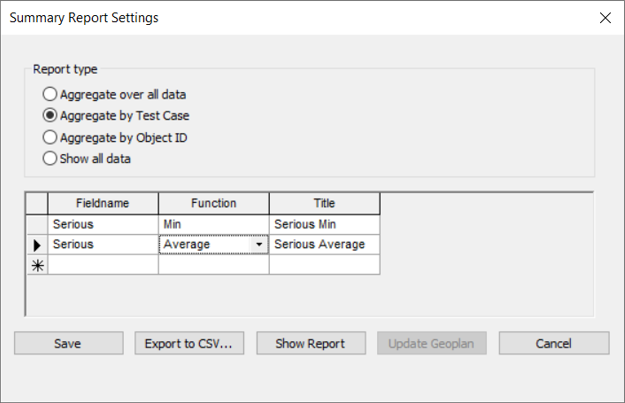
Go to Edit Summary Report Settings. In the image, data is aggregated across test case and the result field “Serious” is aggregated to provide a Minimum and an Average.
-
Click Save to retain these settings. Note that you can change the report settings as often as needed; you do not have to rerun the simulations. Also, remember you can switch to aggregation across object_id in order to see a converse view of the results.
-
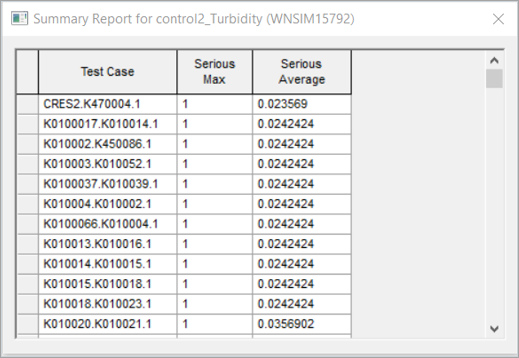
From the context menu, select Open as > Summary report. This gives you a grid, listing “Test Case”, “Serious Max” and “Serious Average”, as specified in the summary report settings.
-
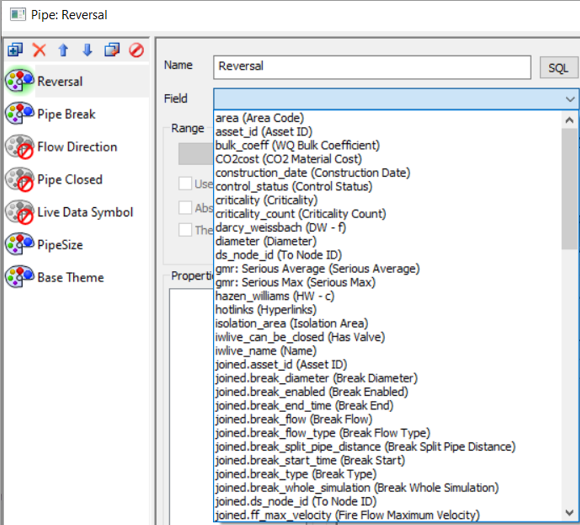
To display this information as a theme in the GeoPlan, select Open as > Summary in GeoPlan in order to load the results into a goeplan. Then go to the Themes editor (image 4). You will see additional results available for theming, always prefixed by “gmr”. In this case you have “gmr.Serious Max” and “gmr.Serious Average” available for theming.