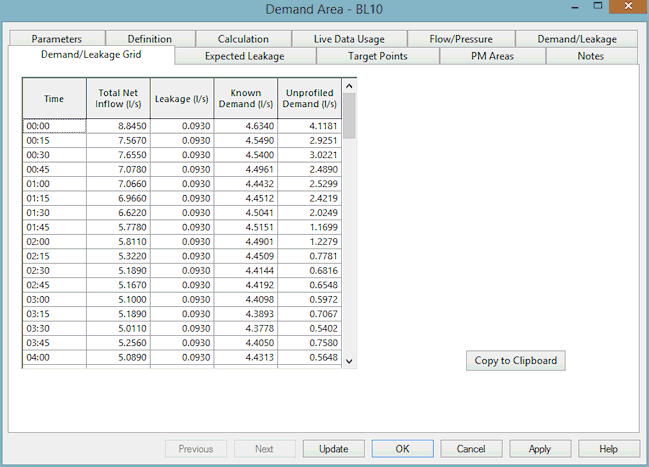
Demand Area Demand/Leakage Grid Page
The Demand/Leakage Grid Page is used to view the Flow Balance results in grid format.
Highlight a selection of cells and click Copy to Clipboard to copy the highlighted data to the clipboard for pasting into another application.
| Data Field | Description |
|---|---|
|
Time |
Timestep in 24 hour period over which the Demand Analysis calculations will be carried out. |
|
Total Net Inflow |
Net inflow into the Demand Area at timestep Time. |
|
Leakage |
Calculated Leakage at timestep Time |
|
Known Demand |
Total demand for all Demand Categories used in the Demand Area that are not described as Leakage Profile or Unprofiled Demand on the Parameters Page at timestep Time |
|
Unprofiled Demand |
Total demand for Demand Category selected as Unprofiled Demand on the Parameters Page at timestep Time. |

The Unprofiled Demand column contains the values that are normalised and updated in the Demand Diagram. Values placed in the Demand Diagram are affected by the Demand Interpolation setting specified on the Parameters Page.
