Using the Demand Area grid window
The Demand Area Grid View is used for viewing, editing and analysing Demand Areas.
To display the view, choose Window | Grid windows | New demand area window. Networks are version controlled objects: see Managing version controlled objects.
Before carrying out Demand Area Analysis in Infoworks the following must be carried out:
- All known demand (metered usage) allocated to the network. The property counts for the Unknown Demand Profile to be calculated by the Demand Area Analysis must be entered in the Node Demand Grid on the Node Demand Page. If customer points are available, the Static Demand Allocation tool should be used to allocate them to the network.
- Large metered consumers must be entered as Direct Demands. Transfer nodes must not be used to represent large metered consumers.
- A Template Demand Diagram set up including Demand Categories for all unprofiled demand and leakage demand to be calculated by the Demand Area Analysis
- Demand Area Codes assigned to nodes or Demand Area Polygons set up
InfoWorks will use the following in order to carry out flow and leakage analysis over a 24 hour period:
- Network
- Control
- Live Data Configuration
- Demand Diagram
- Simulation Results - in same window as network and control view (optional)
The items to be used in the analysis should be open.
Demand Area Grid View context menu Options
Right click the appropriate row of data to display the context menu. To apply a menu item to more than one row, select several rows and then right click. Properties cannot be displayed for more than one row at a time. If there are rows selected, properties will be displayed for the row containing the current cell.
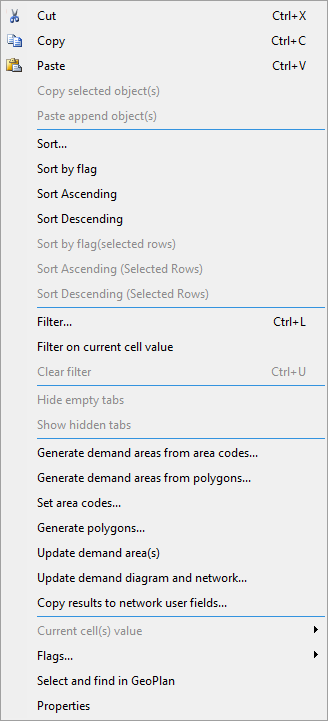
Demand Area Grid View context menu
Generate Demand Areas from Area Codes and Generate Demand Areas from Polygons generates Demand Areas, either from existing Area Codes at node objects, or from a supplied set of polygons. See Generating Demand Areas below for further details.
Set Area Codes sets Area Code of all nodes in Demand Area to the Demand Area ID.
Generate Polygons generates polygons for a collection of contiguous Demand Areas based on Boundary Conditions. The polygons for each area enclose all of the nodes, links and allocated customer points in that area. The polygon boundaries for adjacent areas coincide. The polygons created can either be enclosed by a bounding polygon or else the network extents will be taken as the outer limits to the polygons.
Update Demand Area(s) recalculates demand analysis and carries out validation, reporting the validation result in the grid view.
Update Demand Diagram and Network updates the calculated profile in the Demand Diagram, and/or demand and leakage in the network. See Updating the Demand Diagram and Network below for further details.
Copy results to network user fields copies the results fields to the relevant user number fields for the selected object types.
Select and Find in GeoPlan selects the network objects currently in the selected Demand Areas.
Properties displays the property sheet for the single row selected in the grid. See Demand Area Properties below for further details.
Generating Demand Areas
Right click in the Demand Area Grid View and select either Generate Demand Areas from Area Codes or Generate Demand Areas from Polygons from the context menu. This will display the Generate Demand Areas dialog.
Generate Demand Areas dialog
From Area Codes (recommended)
When generating Demand Areas from Area Codes, InfoWorks will use the following procedure:
- Select a random node in the network. This node becomes a seed node.
- Trace from the seed node until any of the Boundary Conditions or the limits of the network are met. The selected nodes will then be excluded from any subsequent searches.
- Search for any other nodes in the network with the same Demand Area Code as the initially selected seed node.
- For nodes found in Stage 3, Stages 1-3 are repeated. The resultant selection of nodes and links defines the Demand Area.
- Stages 1-4 are repeated until all nodes are excluded from the search and the creation of Demand Areas is complete.
To generate Demand Areas for selected Area Codes only, check the Include Selected Nodes only box. Only nodes currently highlighted on the GeoPlan will be considered for selection as a seed node.
To allow nodes without an area code to be selected as a seed node check the Include Nodes without Area Codes box.
From Polygons
When generating Demand Areas from Polygons, InfoWorks will use the following procedure:
- Select a random node in the network. This node becomes the seed node.
- Trace from the seed node until all other nodes within the polygon are found or until any of the Boundary Conditions are met. The selected nodes will then be excluded from any subsequent searches.
- Search for any other nodes in the network within the current polygon that have the same Demand Area Code as the initially selected seed node.
- For nodes found in Stage 3, Stages 1-3 are repeated.
- Stages 1-4 are repeated until all nodes are excluded from the search and the creation of the Demand Areas is complete.
To generate Demand Ares for selected Polygons only, check the Include Selected Nodes only box. Only nodes currently highlighted on the GeoPlan will be considered for selection as a seed node.
Note: This method will not take split polygons into account.
Updating the Demand Diagram and Network
Right-click in the Demand Area Grid View and select Update Demand Diagram and Network from the context menu. This will display the Update Demand Diagram and Network dialog.
Update Demand Diagram and Network dialog
Demand
Update Demand Diagram - check this box to update the Demand Diagram. The Demand Category profile selected as the Unprofiled Demand on the Demand Area Parameters Page will be updated with the Unprofiled Demand calculated from Demand Area Analysis.
Update Demand in the Network (where Unprofiled Demand is Property Based only) - check this box to update demand assigned to nodes in the network. The Specific Consumption values in the Demand Grid on the Node Demand Page will be updated with Specific Consumption calculated from Demand Area Analysis.
Leakage
Update Leakage in Network - check this box to Update the Leakage assigned to nodes in the Network.
There are two options when updating factored leakage:
- Update as Average Demand - the Average Demand values in the Demand Grid on the Node Demand Page will be updated with Average Demand calculated from Demand Area Analysis
- Update as Property-Based Demand - the Specific Consumption values in the Demand Grid on the Node Demand Page will be updated with Specific Consumption calculated from Demand Area Analysis.
Copying results to network user fields
Right-click in the Demand Area Grid View and select Copy results to network user fields from the context menu. This will display the Copy results to user fields dialog.
Select the Object Types that you want to include using the box. For the Mapping, select from the drop-down menu the appropriate user number.
After clicking OK, the results fields are copied to the relevant user number fields for the selected object types.
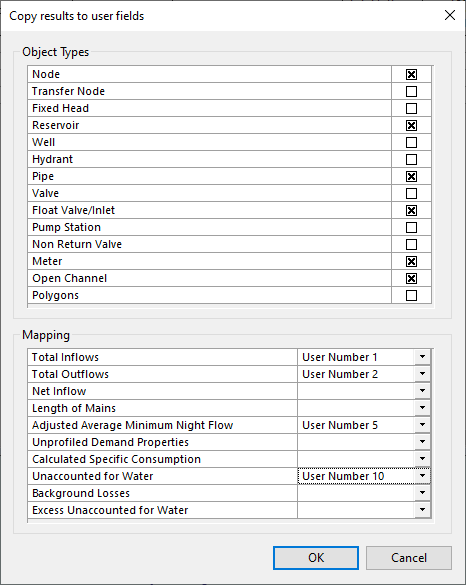
Copy results to user fields dialog
Demand Area Properties
The Demand Area Property Sheet allows you to change the parameters of the demand area and to view the Demand Area Analysis Results.
The Demand Area Property Sheet is made up of the following pages:
- Demand Area Parameters Page
- Demand Area Definition Page
- Demand Area Target Points Page
- Demand Area PM Areas Page
- Demand Area Live Data Usage Page
- Demand Area Flow/Pressure Page
- Demand Area Calculation Page
- Demand Area Demand/Leakage Page
- Demand Area Demand/Leakage Grid Page
- Demand Area Expected Leakage Page
- Notes Page
To display the Demand Area Property Sheet, right click the Demand Area Grid View and select Properties from the context menu.
The following options are available on the Property Sheet:
- Previous - Displays the Property Sheet of the previous Demand Area in the Demand Area grid view
- Next - Displays the Property Sheet of the next Demand Area in the Demand Area grid view
- Update - re-calculates values for the Demand Area
- Apply - Saves changes made to the Property Sheet but does not carry out re-calculation
- OK - Saves changes made and closes Property Sheet but does not carry out re-calculation
- Cancel - Changes made are ignored and the Property Sheet is closed
