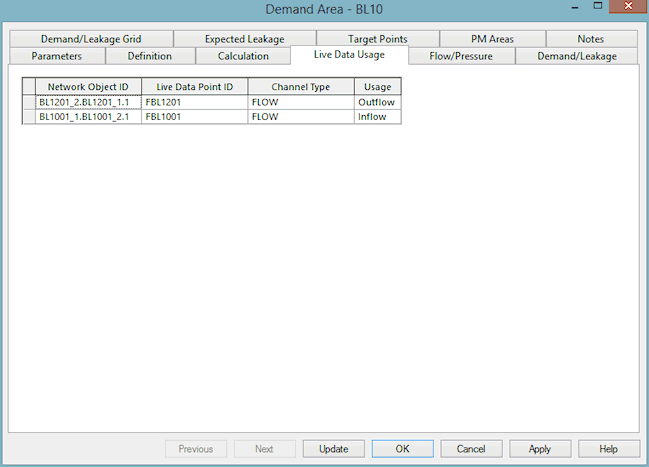
Demand Area Live Data Usage page
The Demand Area Live Data Usage Page is used to view the linked Live Data in the Demand Area. The Live Data Usage Grid shows the Live Data ID, the network object that the Live Data is linked to, the type of Live Data and how the Live Data is used in the demand calculation.
The grid is only populated when the relevant live data configuration file is open, along with the network and control.
The live data Usage may be one of six options:
- Inflow - flow through link is into the Demand Area only*
- Outflow - flow through link is out of the Demand Area only*
- AZNP - live data is used to calculate the Average Zone Night Pressure
- TP - pressure live data is assigned to a Target Point
- Unused - live data is not used in demand area analysis
- Unknown - flow through the link is bi-directional*

* The calculation assumes that the connectivity of the bounding links is in the positive direction of flow. i.e. a bounding link with reversed connectivity will cause an Inflow to be used as an Outflow in the Demand Calculation and vice versa.
The outputs of the live data analysis can be viewed in a graph on the Demand Area Flow/Pressure Page.

