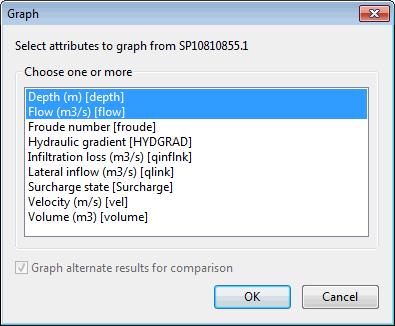
Graph Pick Selection Dialog
This dialog is displayed when viewing simulation results using
the graph pick tool  on the
  Graph option from the context menu.
The graph pick tool is used to display a graph of time varying data for a single network object.
The dialog offers a choice of time varying data to graph. The list will be appropriate to the type of network object selected. More than one parameter can be selected for graphing by using the CTRL and SHIFT keys.
When comparing results in a GeoPlan, the Graph alternate results for comparison option becomes available. Check this option to graph attributes for both simulations currently loaded in the GeoPlan Window. If this option is unchecked, only the results for the first set of simulation results will be graphed.
Select the data to graph and click OK
When graphing results for a single simulation, InfoWorks ICM will display rainfall by default and ground level if graphing a level parameter.

