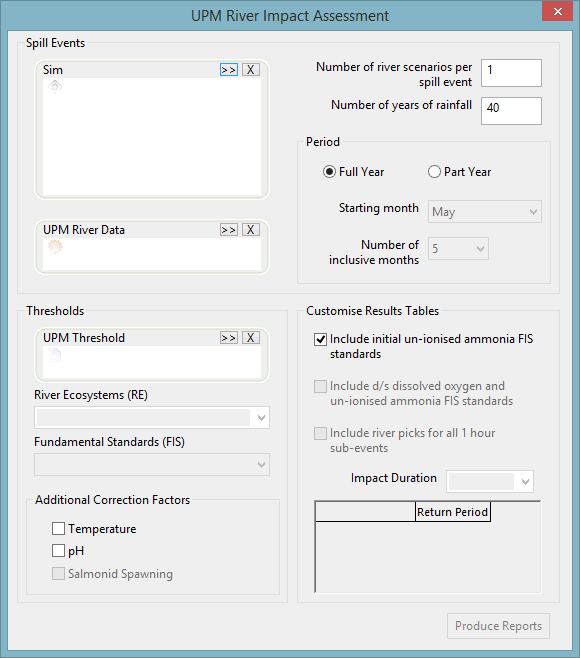
UPM River Impact Assessment Dialog
The UPM (Urban Pollution Management) River Impact Assessment dialog generates a report containing the spills table and river impact assessment table.
The dialog is displayed when you select the UPM River Impact option from the Results menu.
Three of the boxes on the dialog are Master Database Item selection boxes. You can add items by drag-and-drop or by using the buttons provided.
The entries made in this dialog are saved by the system and loaded the next time the dialog is opened.
Fill in the required fields on the dialog and then click on Produce Reports to generate the UPM River Impact Analysis Results.
Spill Events
The Spill Events section allow you to specify the simulation results on which the assessment is to be based and to select the river data to be used and the number of years for which data is to be simulated.
The following fields must be entered:
|
Field |
Description |
|---|---|
|
Sim |
Drag a run or simulation from the Explorer Window onto the Sim droptarget or browse for a run by clicking the Multiple simulations can be selected but all selected simulations must cover the same time period. Gauged results for the selected simulations are used if all outfalls are gauged. If any outfall is not gauged, then non-gauged results are used for all of the analysis. |
|
UPM River Data |
Drag a UPM river data item from the Explorer Window onto the UPM River Data droptarget or browse for a run by clicking the |
|
Number of River Scenarios per Spill Event |
Enter the number of times the assessment is to be calculated for each simulation. |
|
Number of Years of Rainfall |
Enter the number of years of rainfall for which the assessment is to be generated. This must match the length of the rainfall events used in the selected simulations. |
|
Period |
Specify if the available data covers a Full Year or Part Year. If the data only covers part of a year, select the Starting month from which the data starts, then select the Number of inclusive months from the Starting month that the data covers. For example, if running the simulation for summer data only (May to September), select a value of 5; when the Return period is 1 month, the number of allowed exceedances will then be 5 per year. |
The values entered determine the number of times the calculations are performed. For example, if the data covers a 40-year period and the Number of River Scenarios per Spill event is set to 10, the system will effectively calculate data for 400 times for each simulation listed in the Sim box. The results will be different for each scenario, as the data is calculated randomly using the values for mean and variance entered in the UPM River Data dialog.
Thresholds
The Thresholds fields determine the levels against which the results will be tested.
The following fields may be entered:
|
Field |
Description |
|
UPM Threshold |
Select a UPM threshold item. The entry made here affects the choices available in the River Ecosystems and Fundamental Standards lists, and the contents of the Display fields in the Customise Results Tables section. |
|
River Ecosystems (RE) |
Select either one of the five fixed environmental standards or the user-defined thresholds. |
|
Fundamental Standards (FIS) |
Select either one of the three fixed standards (Sustainable Salmonid, Sustainable Cyprinid or Marginal Cyprinid) or the user-defined concentrations. |
|
Additional Correction Factors: Temperature |
Select the Temperature box if you want to apply correction factors for temperature to the un-ionised ammonia concentration thresholds. |
|
Additional Correction Factors: pH |
Select the pH box if you want to apply correction factors for pH to the un-ionised ammonia concentration thresholds. |
|
Additional Correction Factors: Salmonid Spawning |
Select the Salmonid Spawning box if the Sustainable Salmonid standard has been selected and you want to apply correction factors for DO concentrations. |
Customise Results Table
The fundamental intermittent standards (FIS) provide thresholds for dissolved oxygen and un-ionised ammonia concentrations. In each case, you can apply the standards for a range of return periods and impact durations. The fields in the Customise Results Table section determine which of the standards, and which options for each standard, will be tested.
The following fields allow you to choose the standards to be tested:
|
Field |
Description |
|
Include un-ionised ammonia FIS standards |
Select this box if you want to test the results for initial un-ionised ammonia concentrations. |
|
Include dissolved oxygen FIS standards |
Select this box if you want to test the results for downstream dissolved oxygen concentrations and downstream un-ionised ammonia concentrations. |
|
Display: Impact Duration |
Select the Impact Duration for which you want to test the concentrations. |
|
Display: Return Periods |
For the selected Impact Duration value, select the Return Periods for which you want to test the concentrations. The Display selections will apply to both un-ionised ammonia and dissolved oxygen concentrations. |

 button and selecting the desired run or simulation from the